Fig. A.3
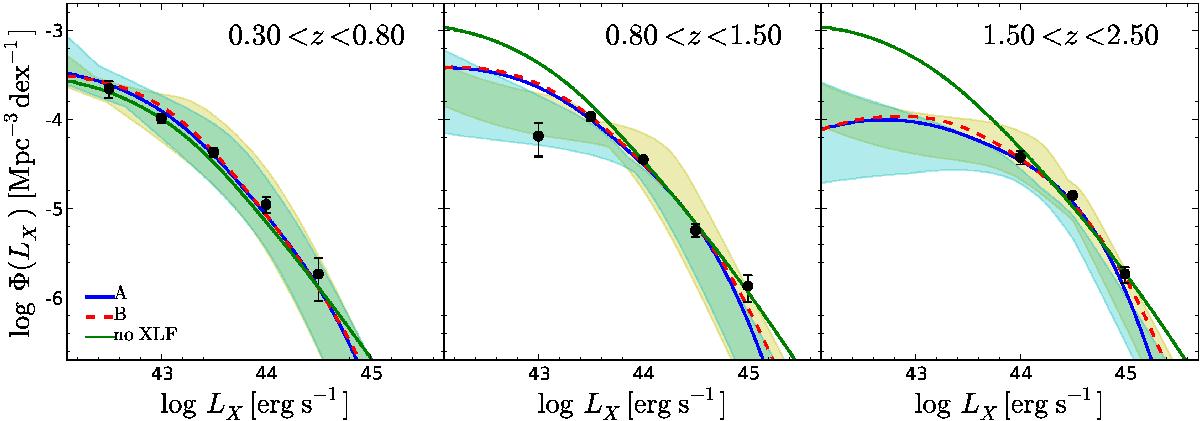
Comparison of the X-ray luminosity function (XLF) predicted by the bivariate distribution Ψ(M⋆,λSAR,z) with direct observations. The blue solid line shows the XLF derived from our default model (A), the red dashed line is for the best-fit M⋆-independent SARDF model (B), and the green solid line is for the best fit without the XLF into the likelihood function (no XLF). The black circles show the binned XLF for our XMM-COSMOS sample using the Vmax method, indicating the luminosity range covered by XMM-COSMOS. The shaded cyan and yellow areas show the XLF by Miyaji et al. (2015) and Ueda et al. (2014), respectively, where the shaded area includes the variation of the XLF over the redshift range of the bin and the uncertainty of the XLF determination.
Current usage metrics show cumulative count of Article Views (full-text article views including HTML views, PDF and ePub downloads, according to the available data) and Abstracts Views on Vision4Press platform.
Data correspond to usage on the plateform after 2015. The current usage metrics is available 48-96 hours after online publication and is updated daily on week days.
Initial download of the metrics may take a while.