Free Access
Fig. 1
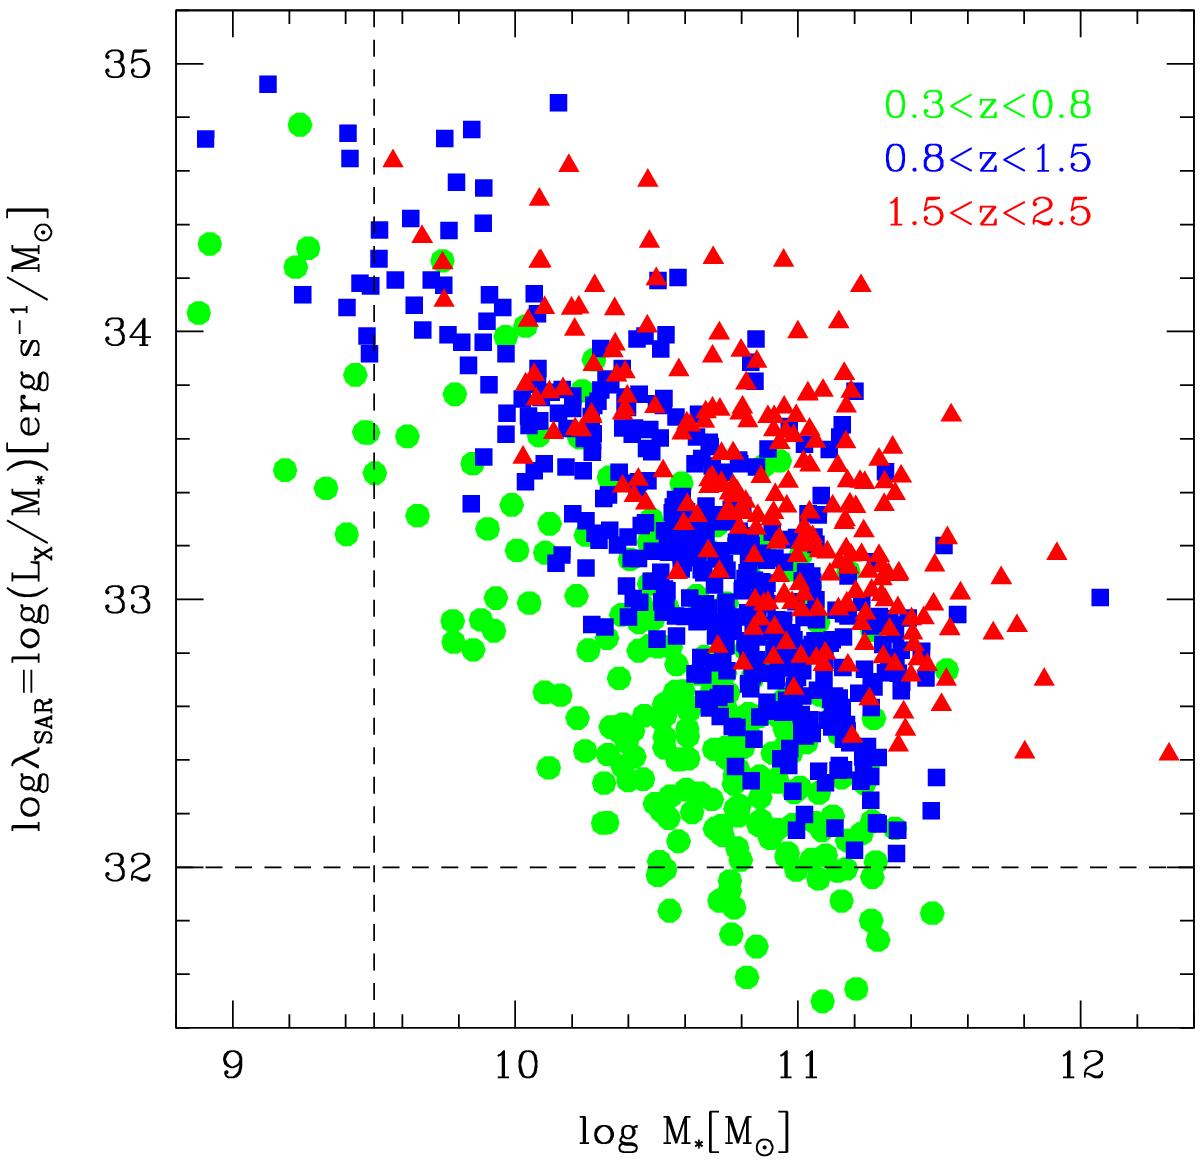
Bivariate distribution for the analyzed hard X-ray selected sample in the M⋆−λSAR plane color-coded according to the redshift bins. The horizontal and vertical dashed lines correspond to the lower limit cuts applied in M⋆ and λSAR.
Current usage metrics show cumulative count of Article Views (full-text article views including HTML views, PDF and ePub downloads, according to the available data) and Abstracts Views on Vision4Press platform.
Data correspond to usage on the plateform after 2015. The current usage metrics is available 48-96 hours after online publication and is updated daily on week days.
Initial download of the metrics may take a while.