Free Access
Fig. 9
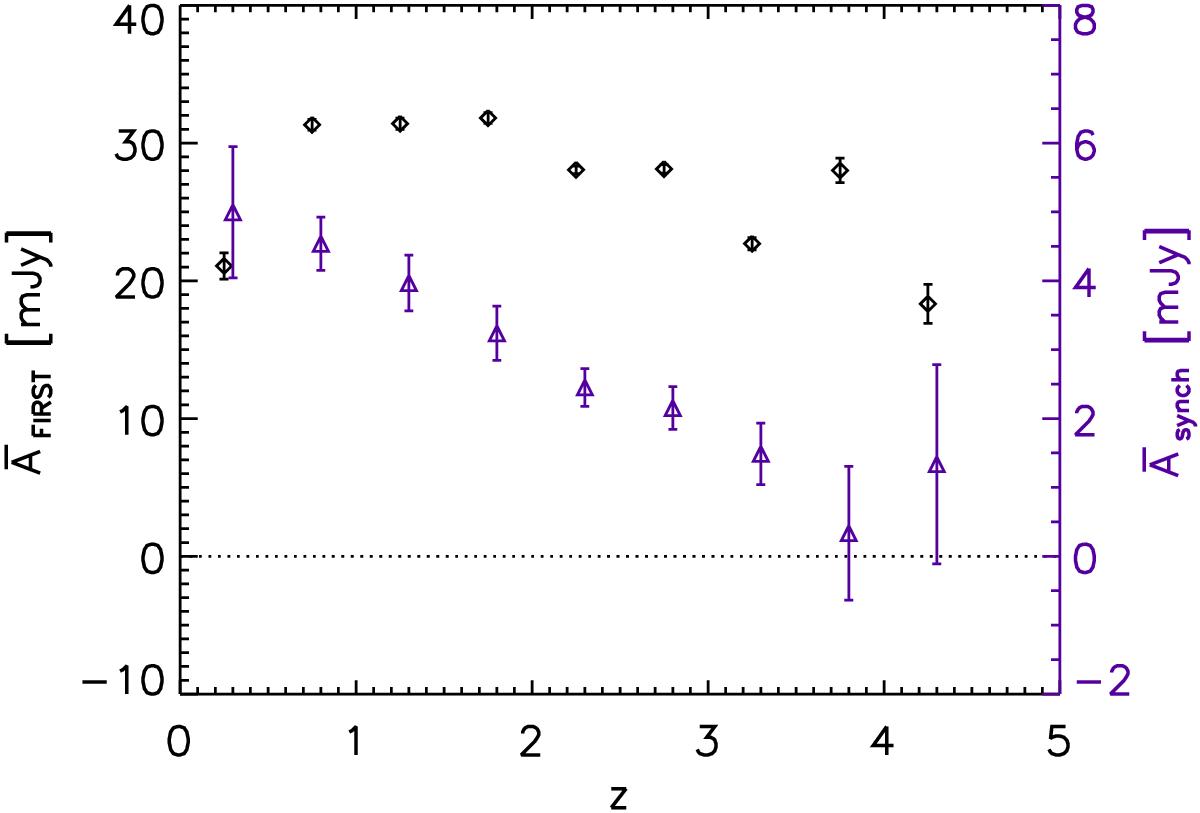
Average FIRST flux density at 1.4 GHz observed frequency compared to the average synchrotron flux density at 100 GHz observed frequency as a function of redshift z. The magenta triangles correspond to the black diamonds in the bottom panel of Fig. 8.
Current usage metrics show cumulative count of Article Views (full-text article views including HTML views, PDF and ePub downloads, according to the available data) and Abstracts Views on Vision4Press platform.
Data correspond to usage on the plateform after 2015. The current usage metrics is available 48-96 hours after online publication and is updated daily on week days.
Initial download of the metrics may take a while.