Fig. 8
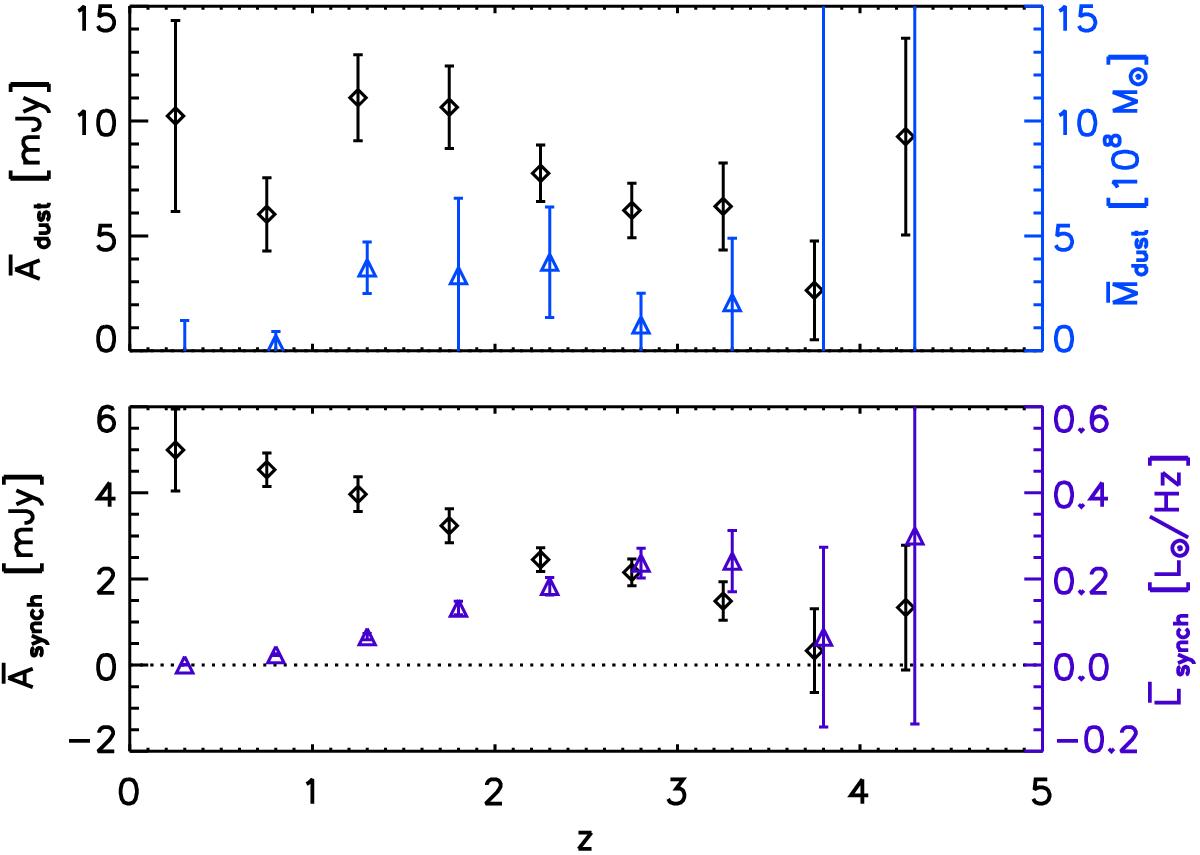
Top panel: average dust flux density (black diamonds) for QSOs with a radio counterpart in the FIRST catalogue. The signal is extracted with the dust + synch filter and marginalized over Td and βd. The corresponding dust mass is shown as the blue triangles. Bottom panel: average synchrotron flux density at 100 GHz observed frequency (black diamonds) and the corresponding monochromatic luminosity (magenta triangles).
Current usage metrics show cumulative count of Article Views (full-text article views including HTML views, PDF and ePub downloads, according to the available data) and Abstracts Views on Vision4Press platform.
Data correspond to usage on the plateform after 2015. The current usage metrics is available 48-96 hours after online publication and is updated daily on week days.
Initial download of the metrics may take a while.