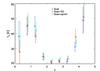
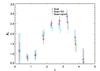
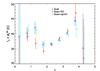
Fig. 6

Top panel: average Td as a function of redshift z. Middle panel: average βd as a function of redshift z. There is a clear evolution between the low-z (z< 1.5) , high-temperature and low-β and the high-z, low-temperature and high-β QSO populations. Bottom panel: average dust ![]() (combination describing the degeneracy line) as a function of redshift z. There is no evidence for evolution of the dust properties between z = 0 and 1.5. The product increases between z = 1.5 and 4.
(combination describing the degeneracy line) as a function of redshift z. There is no evidence for evolution of the dust properties between z = 0 and 1.5. The product increases between z = 1.5 and 4.
Current usage metrics show cumulative count of Article Views (full-text article views including HTML views, PDF and ePub downloads, according to the available data) and Abstracts Views on Vision4Press platform.
Data correspond to usage on the plateform after 2015. The current usage metrics is available 48-96 hours after online publication and is updated daily on week days.
Initial download of the metrics may take a while.