Fig. 5
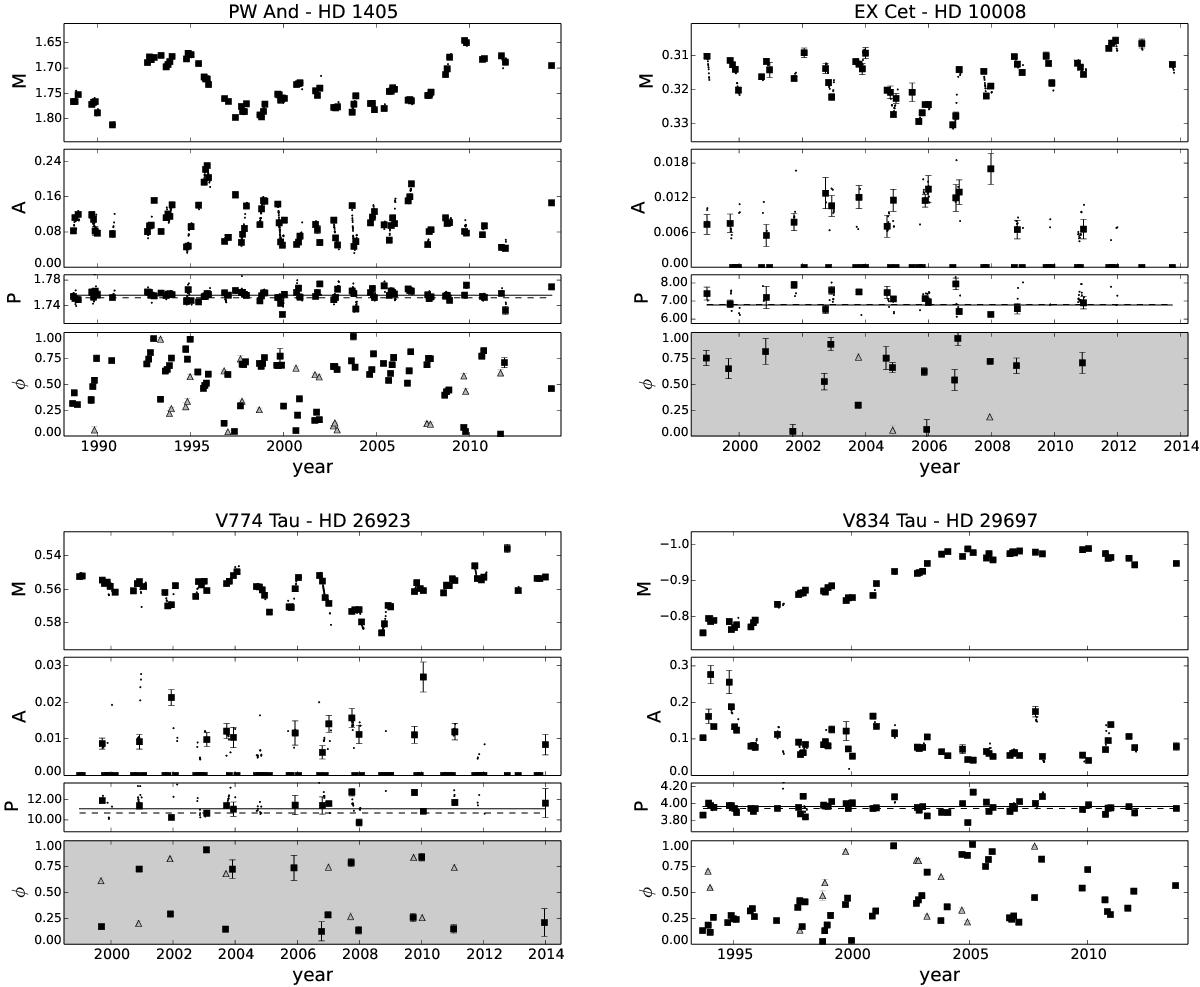
CPS results of M, A, P and φmin for HD 1405, HD 10008, HD 26923, and HD 29697. For M, A, and P the results from the independent datasets are shown with the black squares with error bars while results from the rest of the datasets are shown with points. Datasets with a constant brightness model (K = 0) are shown with A set to 0. The light curve minimum phases φmin phased with Pal are shown in the fourth panel with black squares denoting the primary minima and grey triangles the secondary minima. This panel is shaded grey if the candidate Pal does not have a significant Kuiper statistic. The mean photometric period Pw is shown in the third panel as a solid line and the active longitude period Pal with the dashed line. We note that the error bars are often smaller than the plot symbols.
Current usage metrics show cumulative count of Article Views (full-text article views including HTML views, PDF and ePub downloads, according to the available data) and Abstracts Views on Vision4Press platform.
Data correspond to usage on the plateform after 2015. The current usage metrics is available 48-96 hours after online publication and is updated daily on week days.
Initial download of the metrics may take a while.