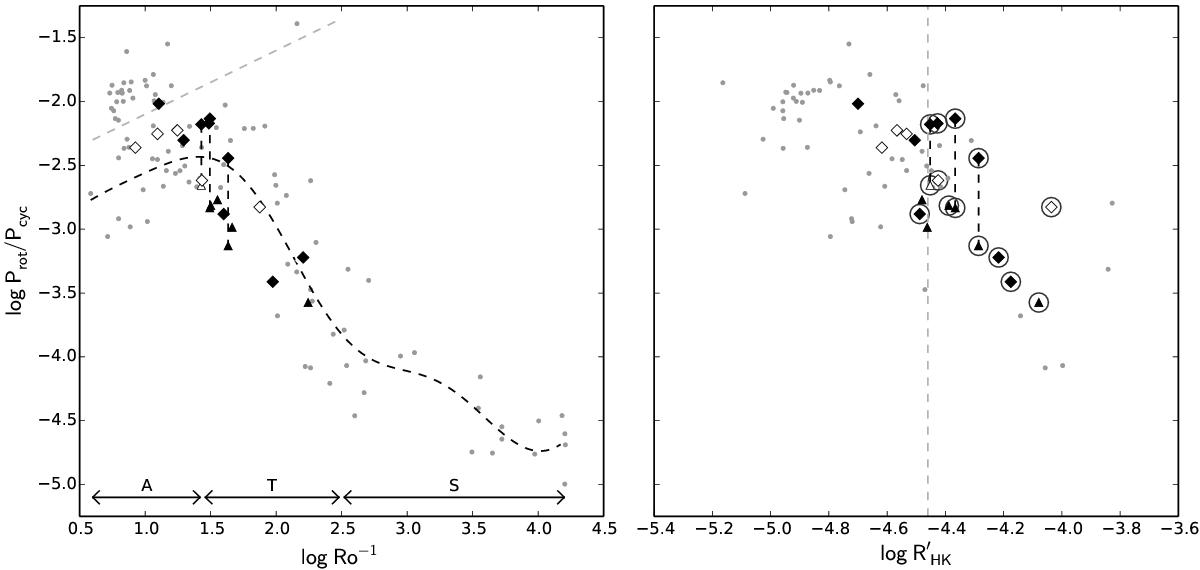
Fig. 14
Left: log Prot/Pcyc vs. log Ro-1. Our stars are marked black if their cycles are graded “fair” or better and white if their cycles are “poor”. Triangles denote stars with cycles labelled “long”, while diamonds are used for the rest of the sample stars. Grey points denote reference data from Saar & Brandenburg (1999). Vertical dashed lines connect the long and short cycles found on the stars HD 63433, HD 82443, and HD 116956. The curved dashed line is a Gaussian process fit to the activity branches apart from the inactive branch, approximately located above the light grey dashed line. Approximate ranges of the active, transitional and superactive branches are denoted by the horizontal arrows labelled “A”, “T” and “S”. Right: same as on the left but for log Prot/Pcyc vs. ![]() . Stars in our sample that have detected active longitudes are circled in the plot. The grey vertical dashed line marks the approximate divide between the active stars with active longitudes and the less active ones without them. The scale for log Prot/Pcyc is identical in both panels.
. Stars in our sample that have detected active longitudes are circled in the plot. The grey vertical dashed line marks the approximate divide between the active stars with active longitudes and the less active ones without them. The scale for log Prot/Pcyc is identical in both panels.
Current usage metrics show cumulative count of Article Views (full-text article views including HTML views, PDF and ePub downloads, according to the available data) and Abstracts Views on Vision4Press platform.
Data correspond to usage on the plateform after 2015. The current usage metrics is available 48-96 hours after online publication and is updated daily on week days.
Initial download of the metrics may take a while.