Free Access
Fig. 4
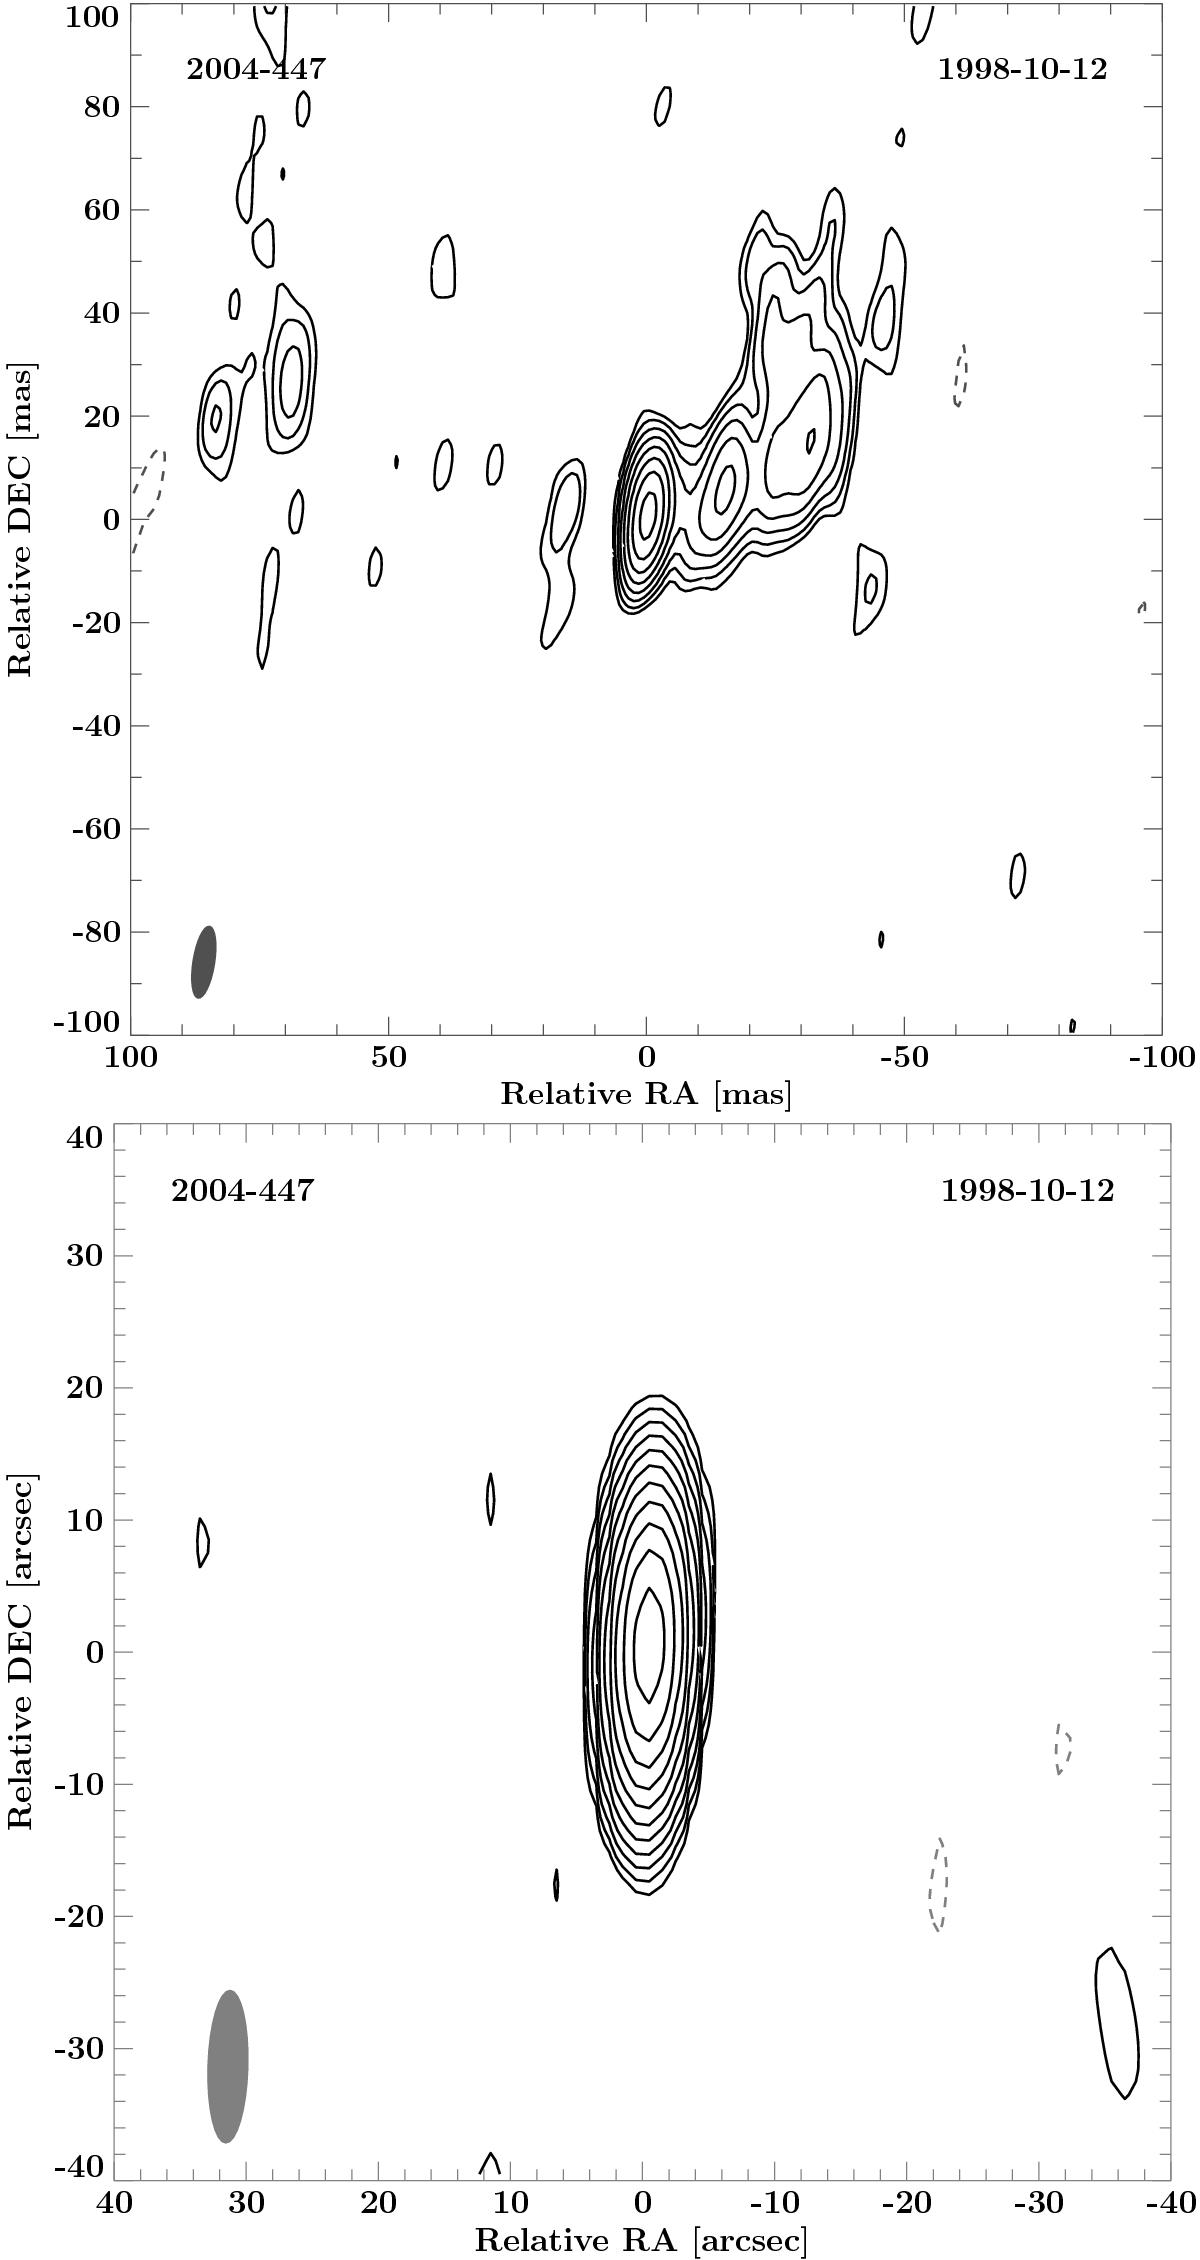
VLBA (top) and VLA (bottom) image of 2004-447 at 1.5 GHz with the image parameters given in Table 1. Contour lines begin at 3 times the image rms and increase logarithmically by a factor of 2. Grey dashed contour lines indicate negative flux density. The grey ellipse in the bottom left corner depicts the restoring beam.
This figure is made of several images, please see below:
Current usage metrics show cumulative count of Article Views (full-text article views including HTML views, PDF and ePub downloads, according to the available data) and Abstracts Views on Vision4Press platform.
Data correspond to usage on the plateform after 2015. The current usage metrics is available 48-96 hours after online publication and is updated daily on week days.
Initial download of the metrics may take a while.