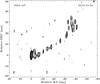
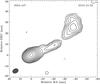
Fig. 3
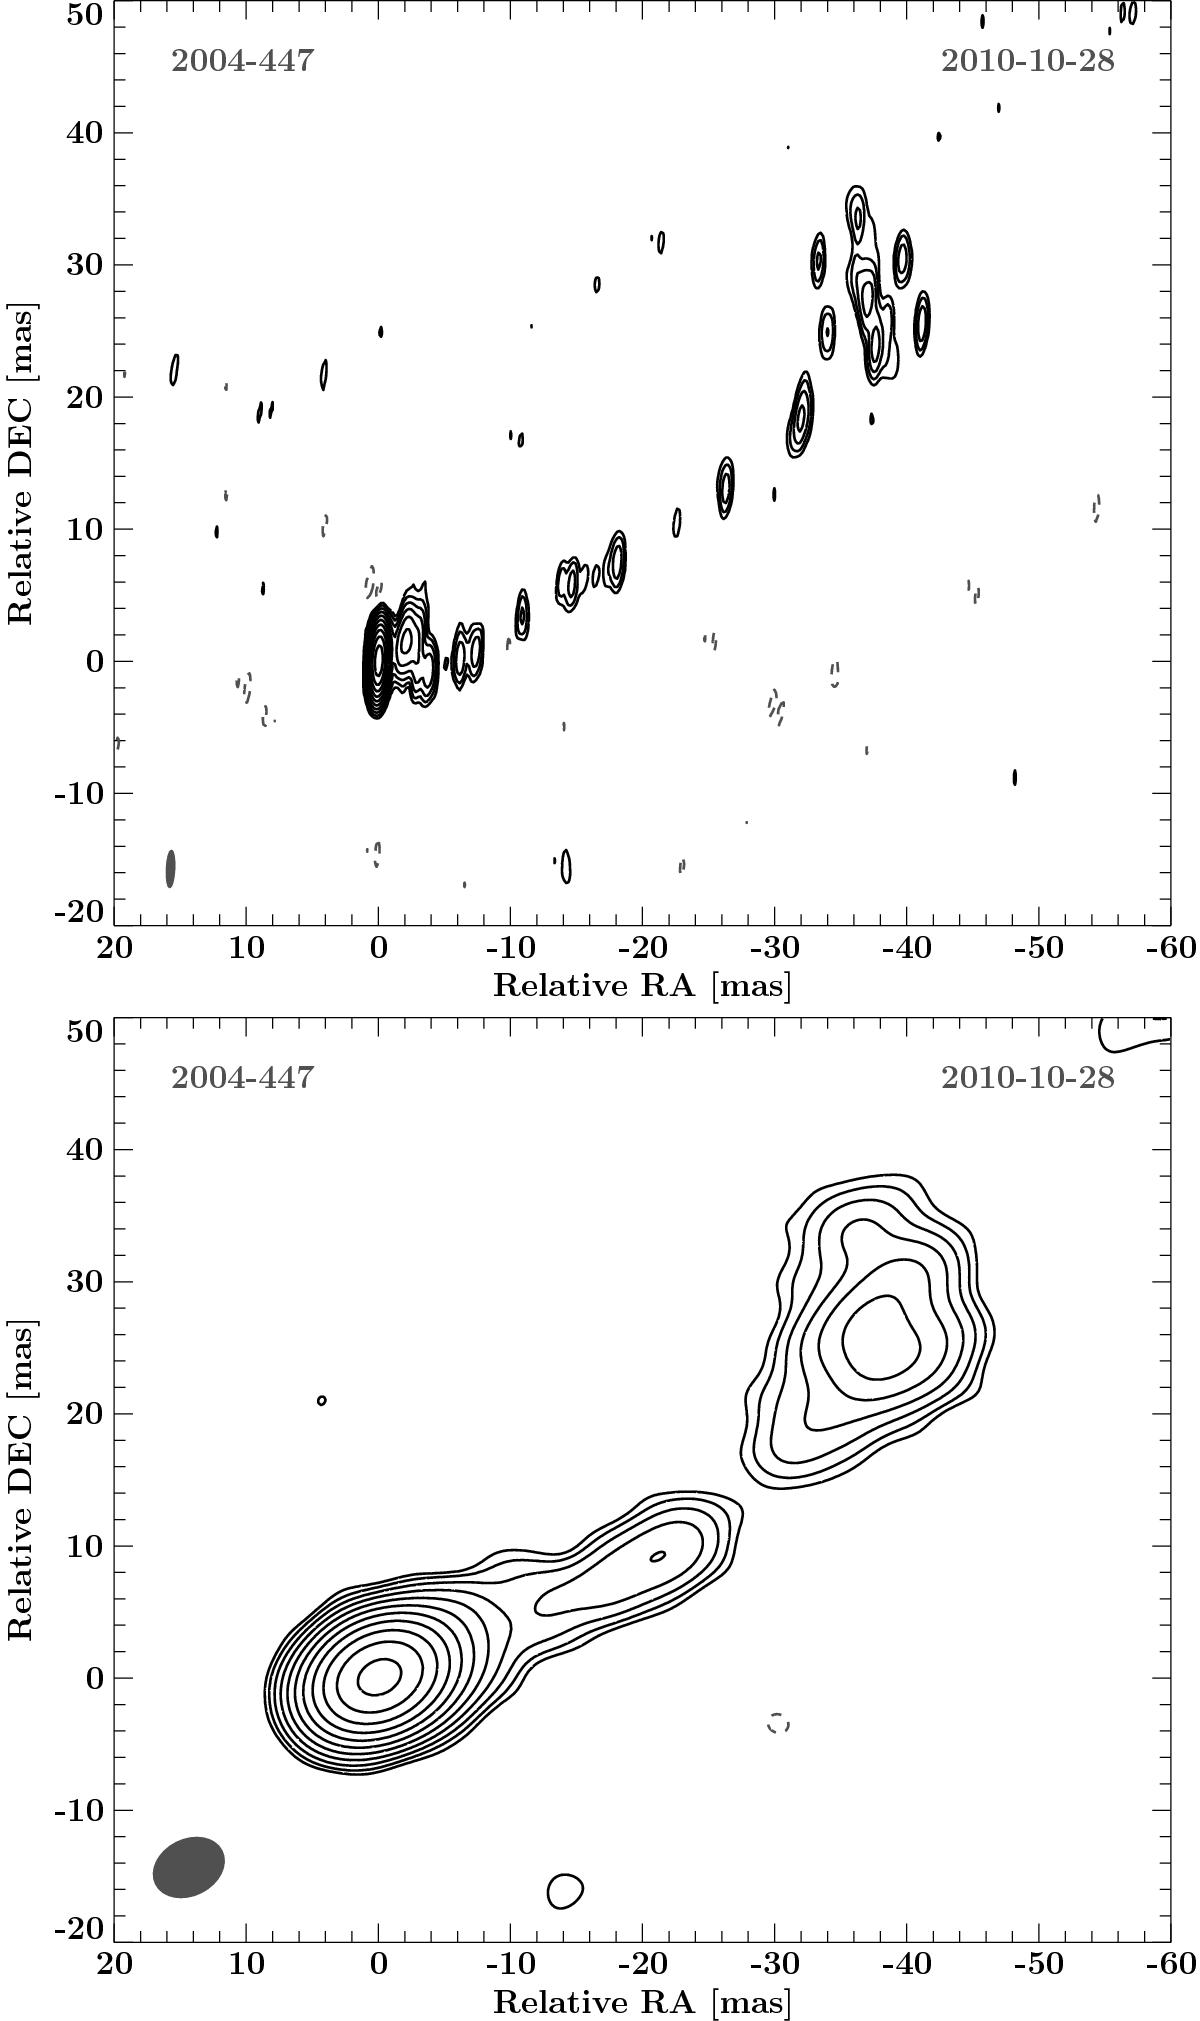
Top: full-resolution TANAMI image of 2004-447 at 8.4 GHz; bottom: tapered TANAMI image of 2004-447 at 8.4 GHz. The contour lines of each image start at three times the rms of the image, increasing logarithmically by a factor of two. Negative flux density noise peaks are shown by dashed grey contour lines. The grey ellipse in the bottom left of both images depicts their respective restoring beams. The image parameters are shown in Table 1.
Current usage metrics show cumulative count of Article Views (full-text article views including HTML views, PDF and ePub downloads, according to the available data) and Abstracts Views on Vision4Press platform.
Data correspond to usage on the plateform after 2015. The current usage metrics is available 48-96 hours after online publication and is updated daily on week days.
Initial download of the metrics may take a while.