Fig. 2
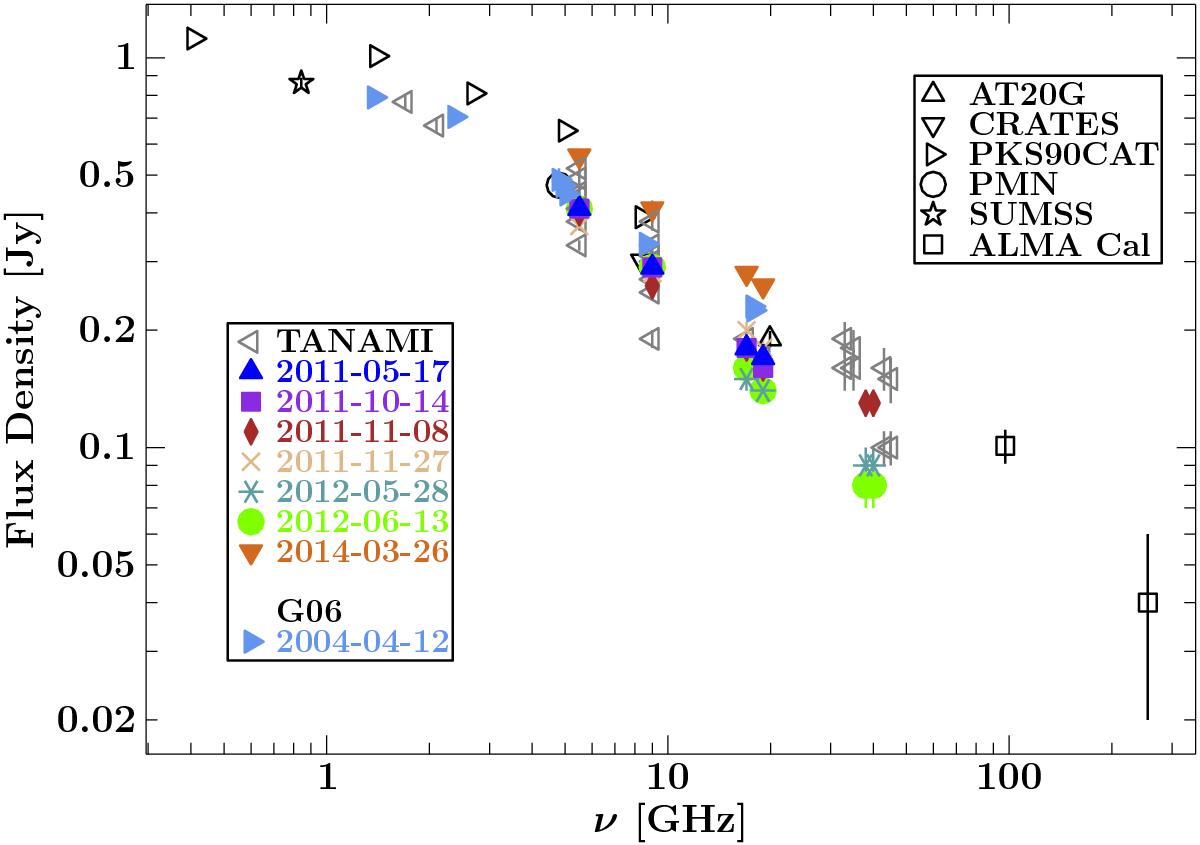
Spectrum of ATCA monitoring (Fig. 1) between 1.7 GHz and 45 GHz from 2010 Feb. 13 to 2014 Mar. 26. Data for which spectral index fits were performed, are shown in colour. Simultaneous archival data were taken from G06 (blue, right-oriented triangles). Non-simultaneous archival data from various catalogues are shown in grey: AT20G (asterisk, Murphy et al. 2010; Chhetri et al. 2013), CRATES (bottom-oriented triangles, Healey et al. 2007, PKS90CAT (right-oriented triangles, Wright & Otrupcek 1990), PMN (circles, Griffith & Wright 1994; Wright et al. 1994), SUMSS (stars, Mauch et al. 2013), and ALMA Cal (rectangles, Fomalont et al. 2014).
Current usage metrics show cumulative count of Article Views (full-text article views including HTML views, PDF and ePub downloads, according to the available data) and Abstracts Views on Vision4Press platform.
Data correspond to usage on the plateform after 2015. The current usage metrics is available 48-96 hours after online publication and is updated daily on week days.
Initial download of the metrics may take a while.