Free Access
Fig. A.2
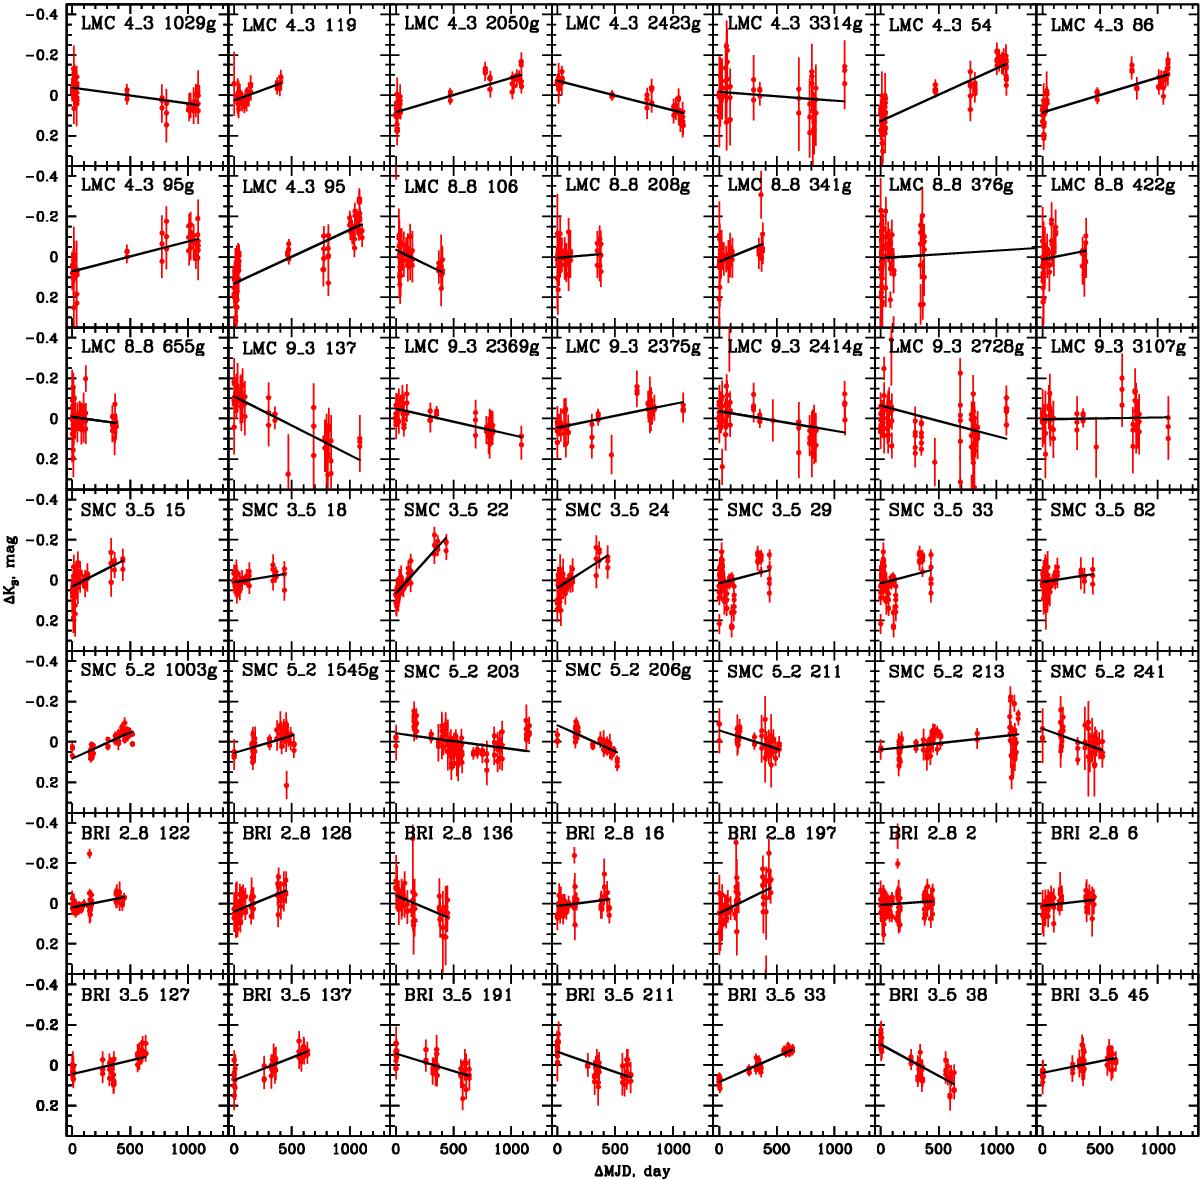
Light curves of the observed targets with their measurement errors as function of the time since the first available VMC observation. The lines show linear fits to the light curve, following Cioni et al. (2013).
Current usage metrics show cumulative count of Article Views (full-text article views including HTML views, PDF and ePub downloads, according to the available data) and Abstracts Views on Vision4Press platform.
Data correspond to usage on the plateform after 2015. The current usage metrics is available 48-96 hours after online publication and is updated daily on week days.
Initial download of the metrics may take a while.