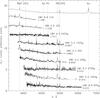
Fig. 3
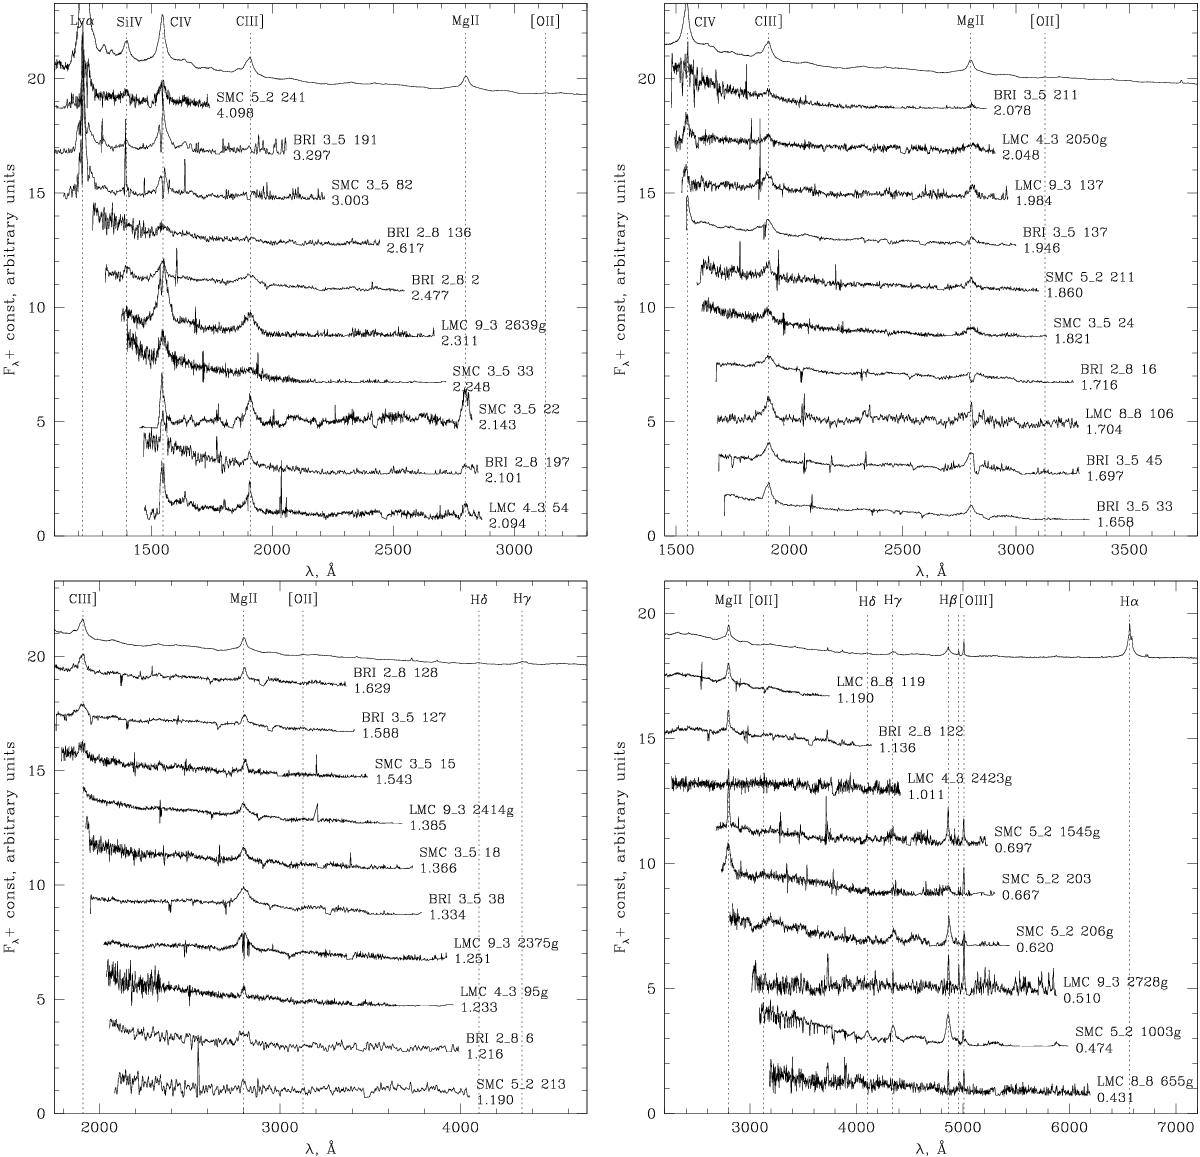
Spectra of the quasar candidates sorted by redshift and shifted to rest-frame wavelength. The spectra were normalized to an average value of one and shifted vertically by offsets of two, four, etc., for display purposes. The SDSS composite quasar spectrum (Vanden Berk et al. 2001) is shown at the top of all panels. A sky spectrum is shown at the bottom of the fifth panel (see the next page). Objects with no measured redshift due to lack of lines or low signal-to-noise are plotted assuming z = 0 in the fifth panel next to the sky spectrum to facilitate the identification of the residuals from the sky emission lines.
Current usage metrics show cumulative count of Article Views (full-text article views including HTML views, PDF and ePub downloads, according to the available data) and Abstracts Views on Vision4Press platform.
Data correspond to usage on the plateform after 2015. The current usage metrics is available 48-96 hours after online publication and is updated daily on week days.
Initial download of the metrics may take a while.