Fig. 1
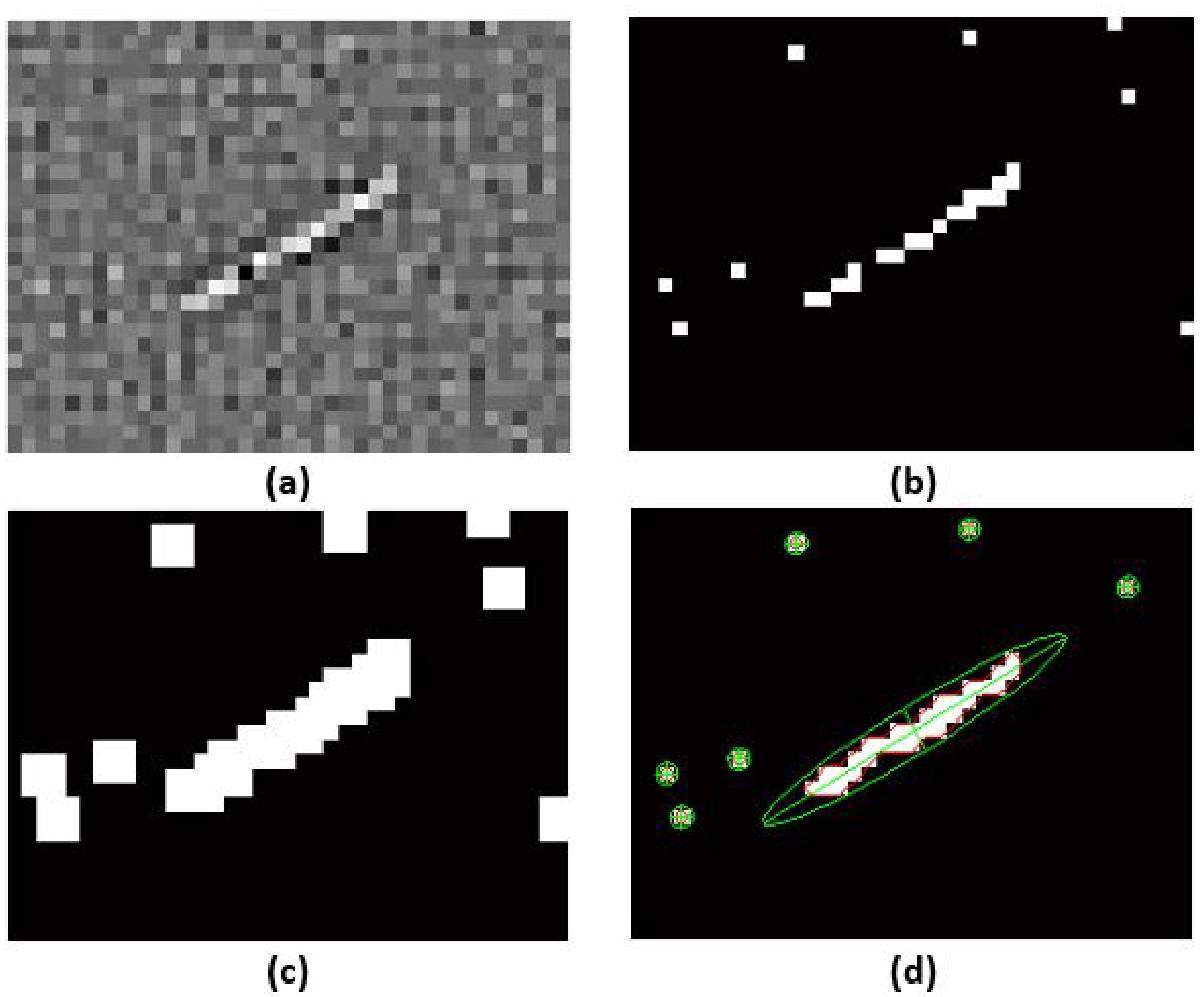
a) An example of the result of the Laplace filtering of the difference of two following NAC images. b) Boolean mask of the grain track identified by the definition of an adequate threshold. c) Result of the dilatation process. Finally, d) shows the result (after erosion filtering). In red is the isocurve of the border of the grain and in green the ellipsoid fit (expanded for visibility) used to distinguish the grain from other features by eccentricity.
Current usage metrics show cumulative count of Article Views (full-text article views including HTML views, PDF and ePub downloads, according to the available data) and Abstracts Views on Vision4Press platform.
Data correspond to usage on the plateform after 2015. The current usage metrics is available 48-96 hours after online publication and is updated daily on week days.
Initial download of the metrics may take a while.