Fig. 7
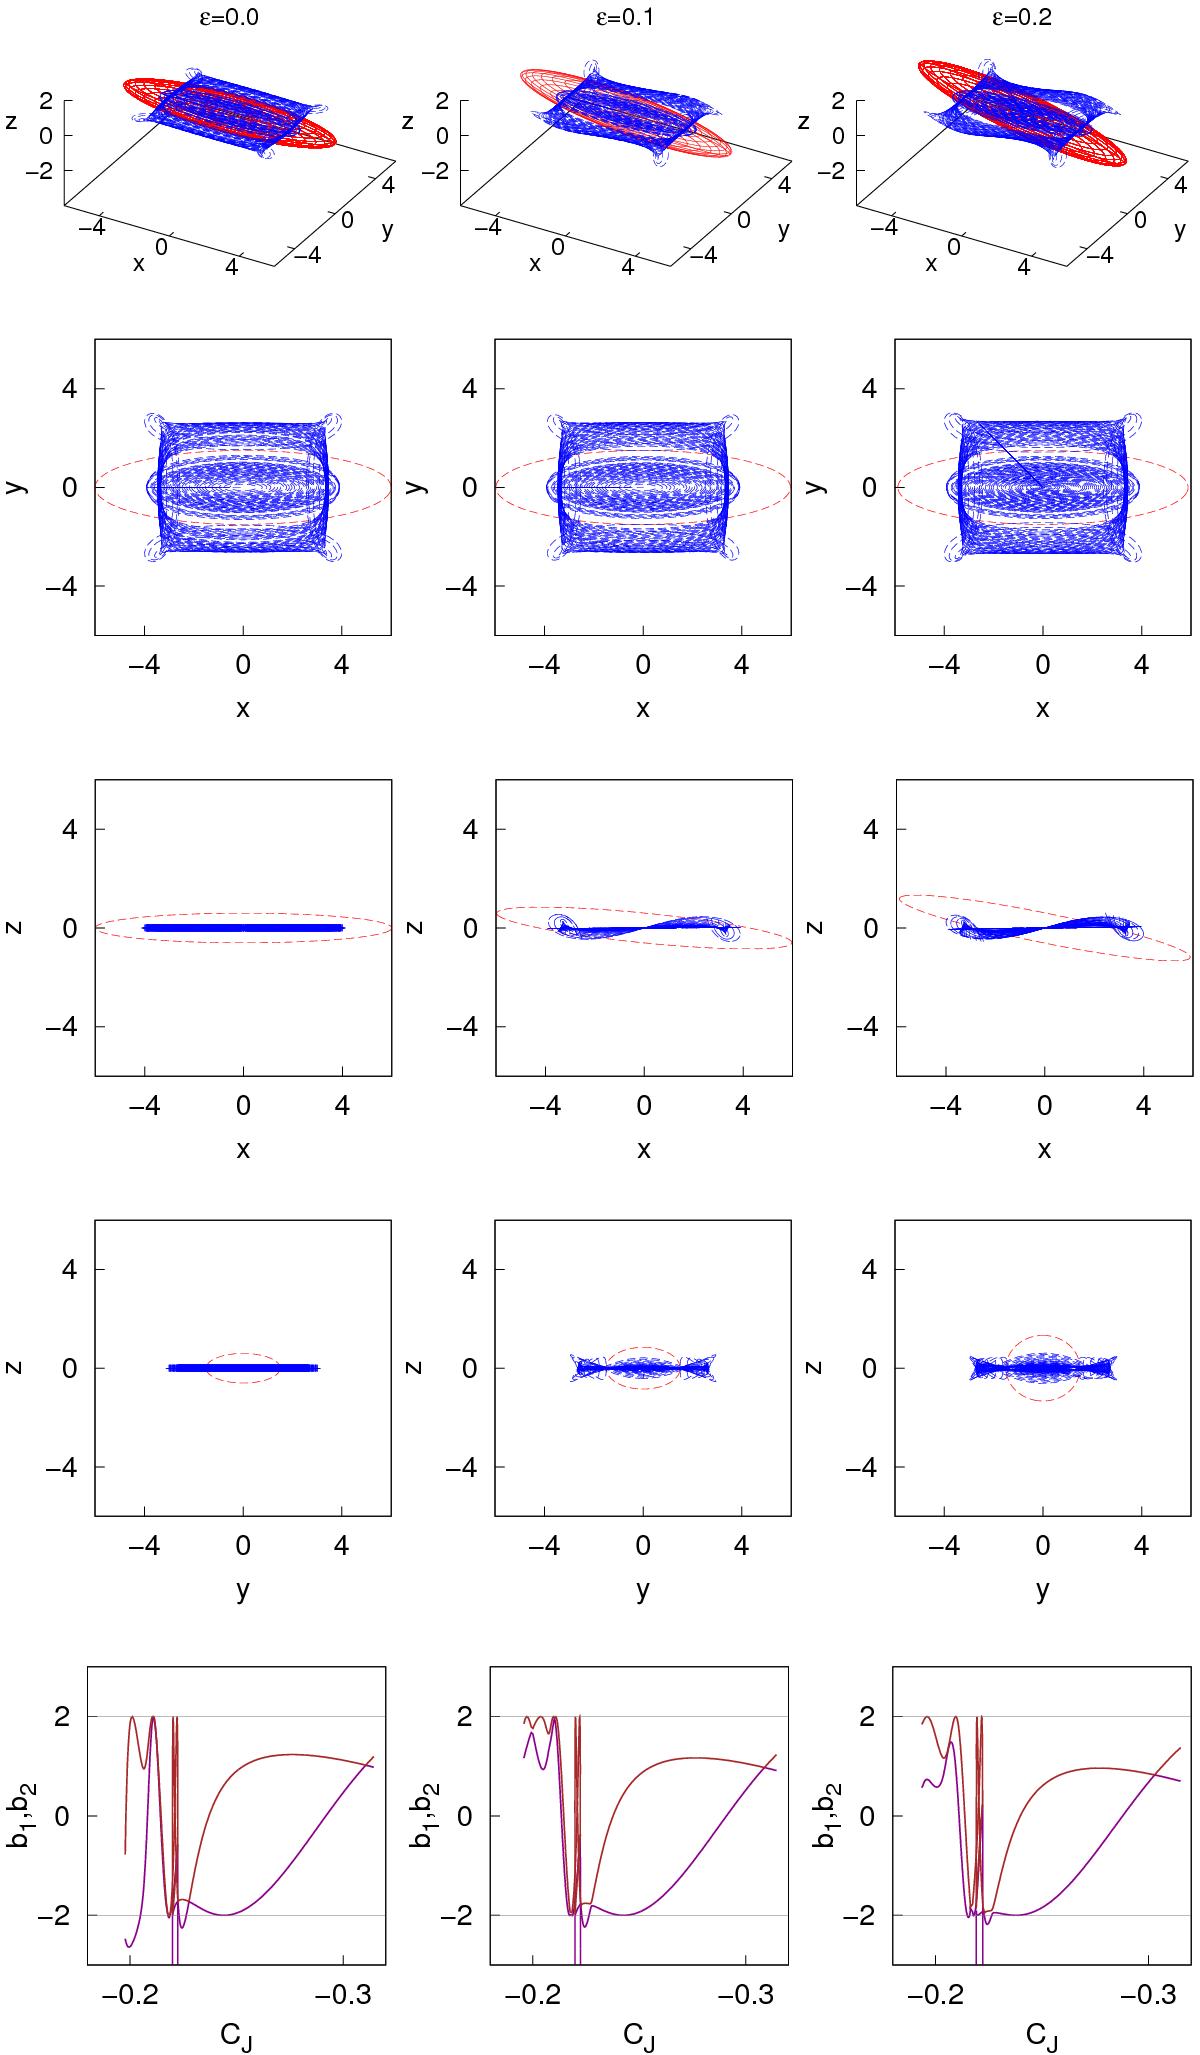
Family of periodic orbits of the precessing model with b ≠ c and GMb = 0.1 (first row: 3D view; second, third, and fourth rows: (x,y), (x,z), and (y,z) projections, respectively) and stability indexes (bottom row) for ε = 0,0.1,0.2 (left, middle and right columns, respectively). In the first four rows, the red dashed lines outline the position of the triaxial Ferrers bar, while the blue lines are periodic orbits of the precessing model. In the bottom row: dark magenta (brown) lines indicate the b1 (b2) stability index.
Current usage metrics show cumulative count of Article Views (full-text article views including HTML views, PDF and ePub downloads, according to the available data) and Abstracts Views on Vision4Press platform.
Data correspond to usage on the plateform after 2015. The current usage metrics is available 48-96 hours after online publication and is updated daily on week days.
Initial download of the metrics may take a while.