Free Access
Fig. 6
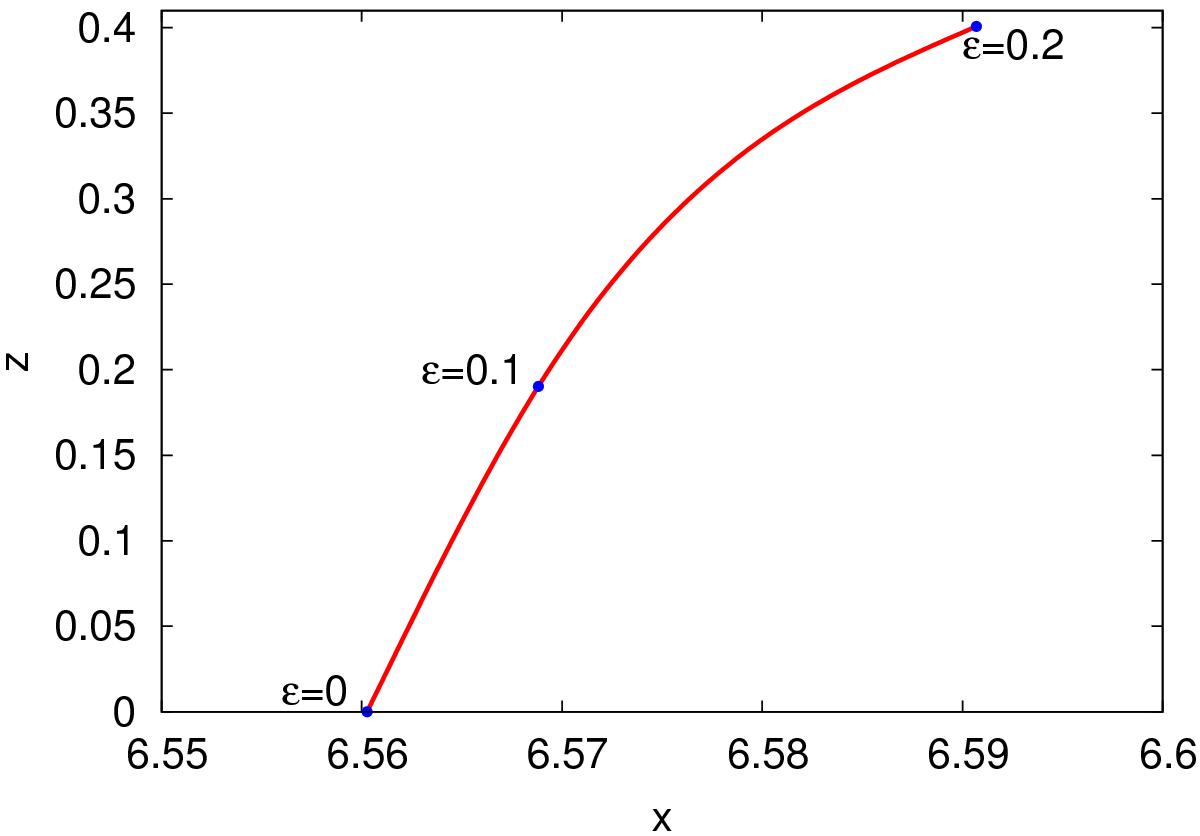
Variation of the xz coordinates of L1 as ε varies within the range ε ∈ [0,0.2] for the precessing model with GMb = 0.1. The marked dots show the L1 coordinates for three specific values of ε: ε = 0 (bottom part of the plot), ε = 0.1 (middle), and ε = 0.2 (top).
Current usage metrics show cumulative count of Article Views (full-text article views including HTML views, PDF and ePub downloads, according to the available data) and Abstracts Views on Vision4Press platform.
Data correspond to usage on the plateform after 2015. The current usage metrics is available 48-96 hours after online publication and is updated daily on week days.
Initial download of the metrics may take a while.