Free Access
Fig. 5
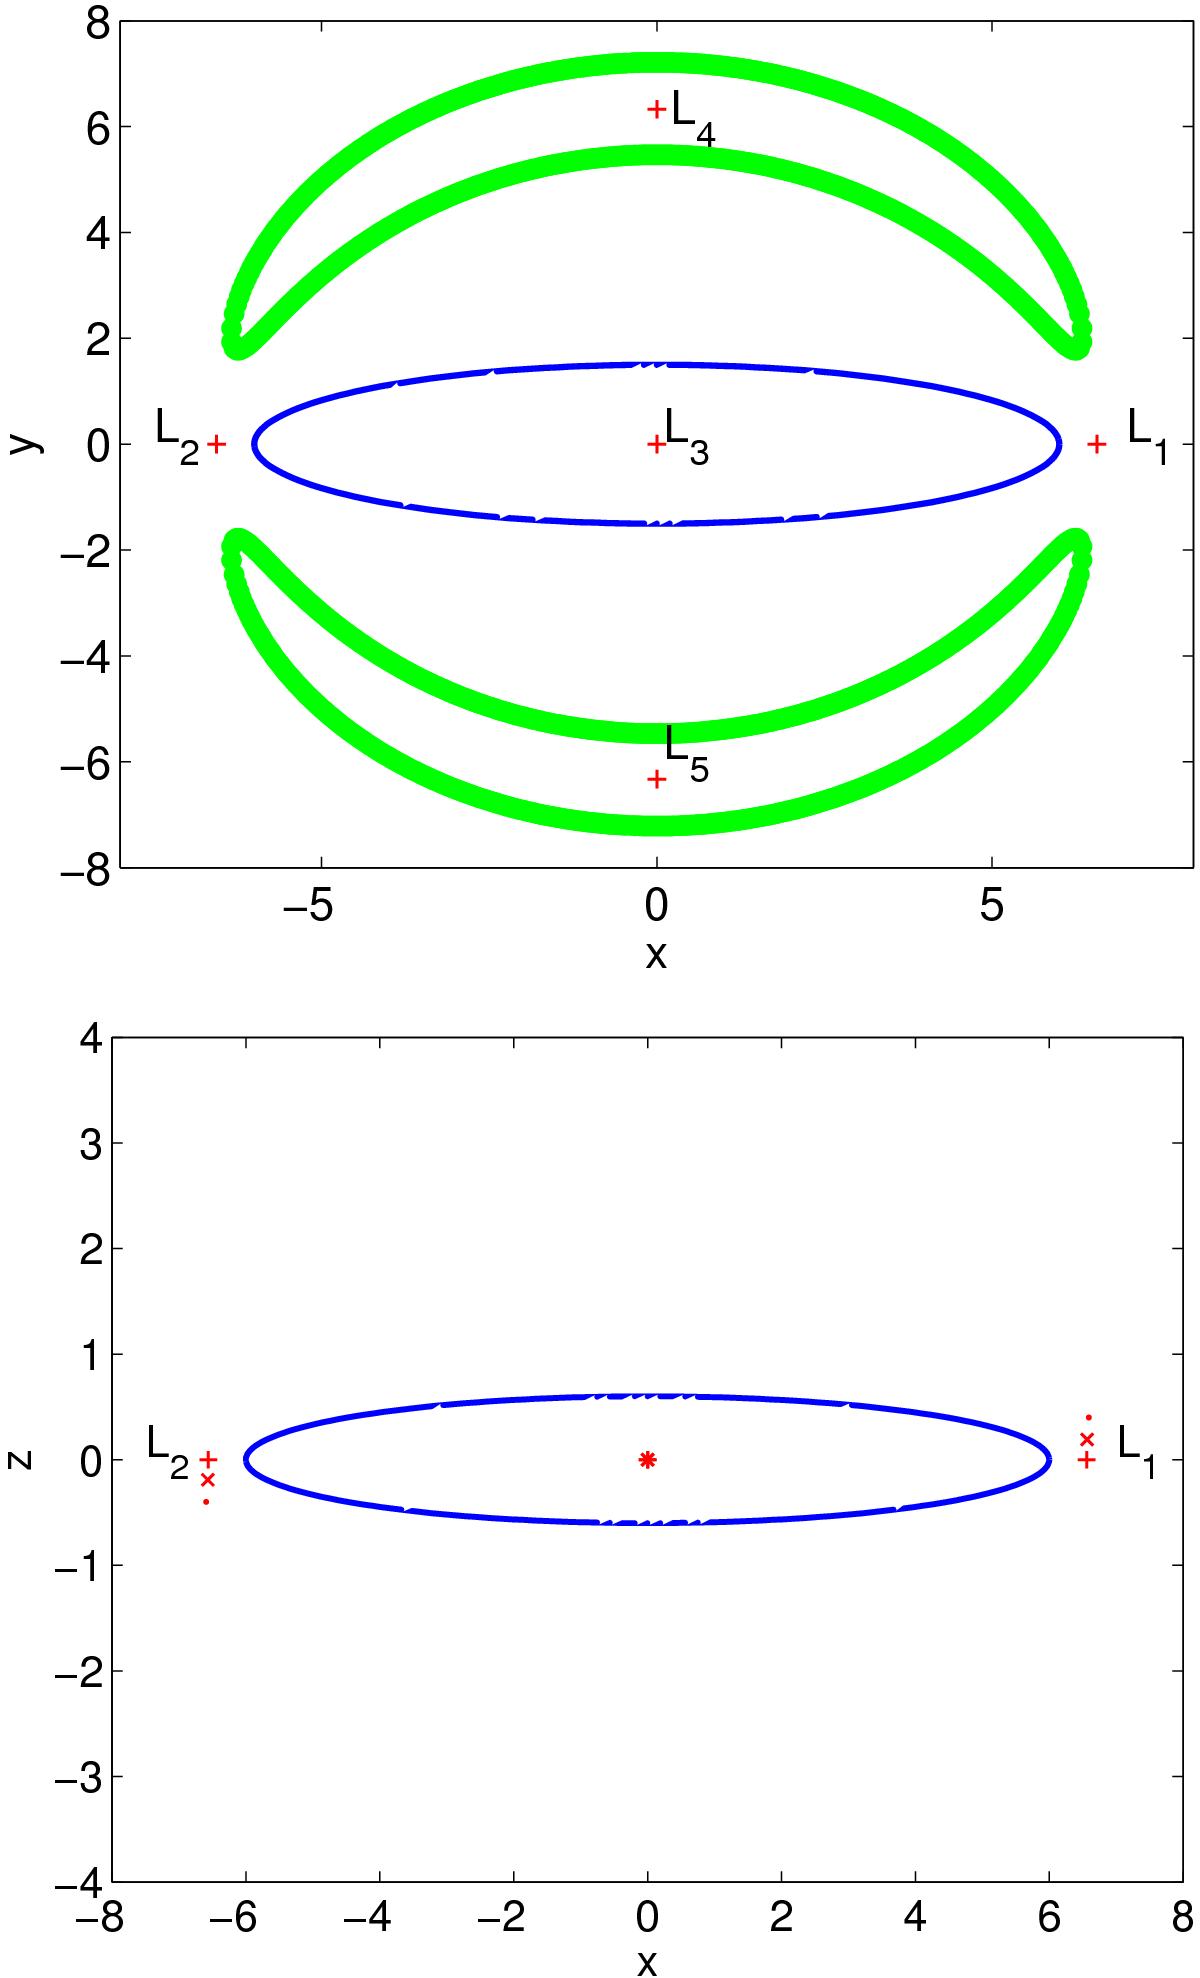
Equilibrium points of the precessing model with GMb = 0.1. Top: xy plane with zero velocity curves for a Jacobi constant CJ = −0.1876. Bottom: xz plane, “+” for ε = 0, “×” for ε = 0.1, “•” for ε = 0.2, while the “∗” shows the position of the central L3 point. The blue curve in both panels outlines the triaxial Ferrers bar.
This figure is made of several images, please see below:
Current usage metrics show cumulative count of Article Views (full-text article views including HTML views, PDF and ePub downloads, according to the available data) and Abstracts Views on Vision4Press platform.
Data correspond to usage on the plateform after 2015. The current usage metrics is available 48-96 hours after online publication and is updated daily on week days.
Initial download of the metrics may take a while.