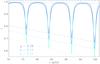
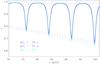
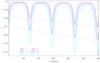
Fig. 2

Function ζ(ν) for different sets of q and ΔΠ1 values representative of various evolutionary stages, obtained with the method illustrated in Fig. 1. Top: typical ΔΠ1 values on the RGB, with different values of q, Δν = 8 μHz, and ΔΠ1 = 70 s. Compared to high q, low q values correspond to deeper minima and ζ near to 1 for gravity-dominated mixed modes. Middle: Δν = 8 μHz, q = 0.15, and different values of ΔΠ1 found on the RGB. All curves are very similar. Bottom: Δν = 8 μHz, q = 0.15, and different values of ΔΠ1 found either on the RGB, or in the red clump. Even if large variations are seen in that case, the bijection (Eq. (8)) ensures a correction that is efficient enough to iterate the value of ΔΠ1. The minimum and maximum values of ζ, respectively reached for pressure or gravity-dominated mixed modes, are plotted in dashed and dotted lines.
Current usage metrics show cumulative count of Article Views (full-text article views including HTML views, PDF and ePub downloads, according to the available data) and Abstracts Views on Vision4Press platform.
Data correspond to usage on the plateform after 2015. The current usage metrics is available 48-96 hours after online publication and is updated daily on week days.
Initial download of the metrics may take a while.