Fig. 3
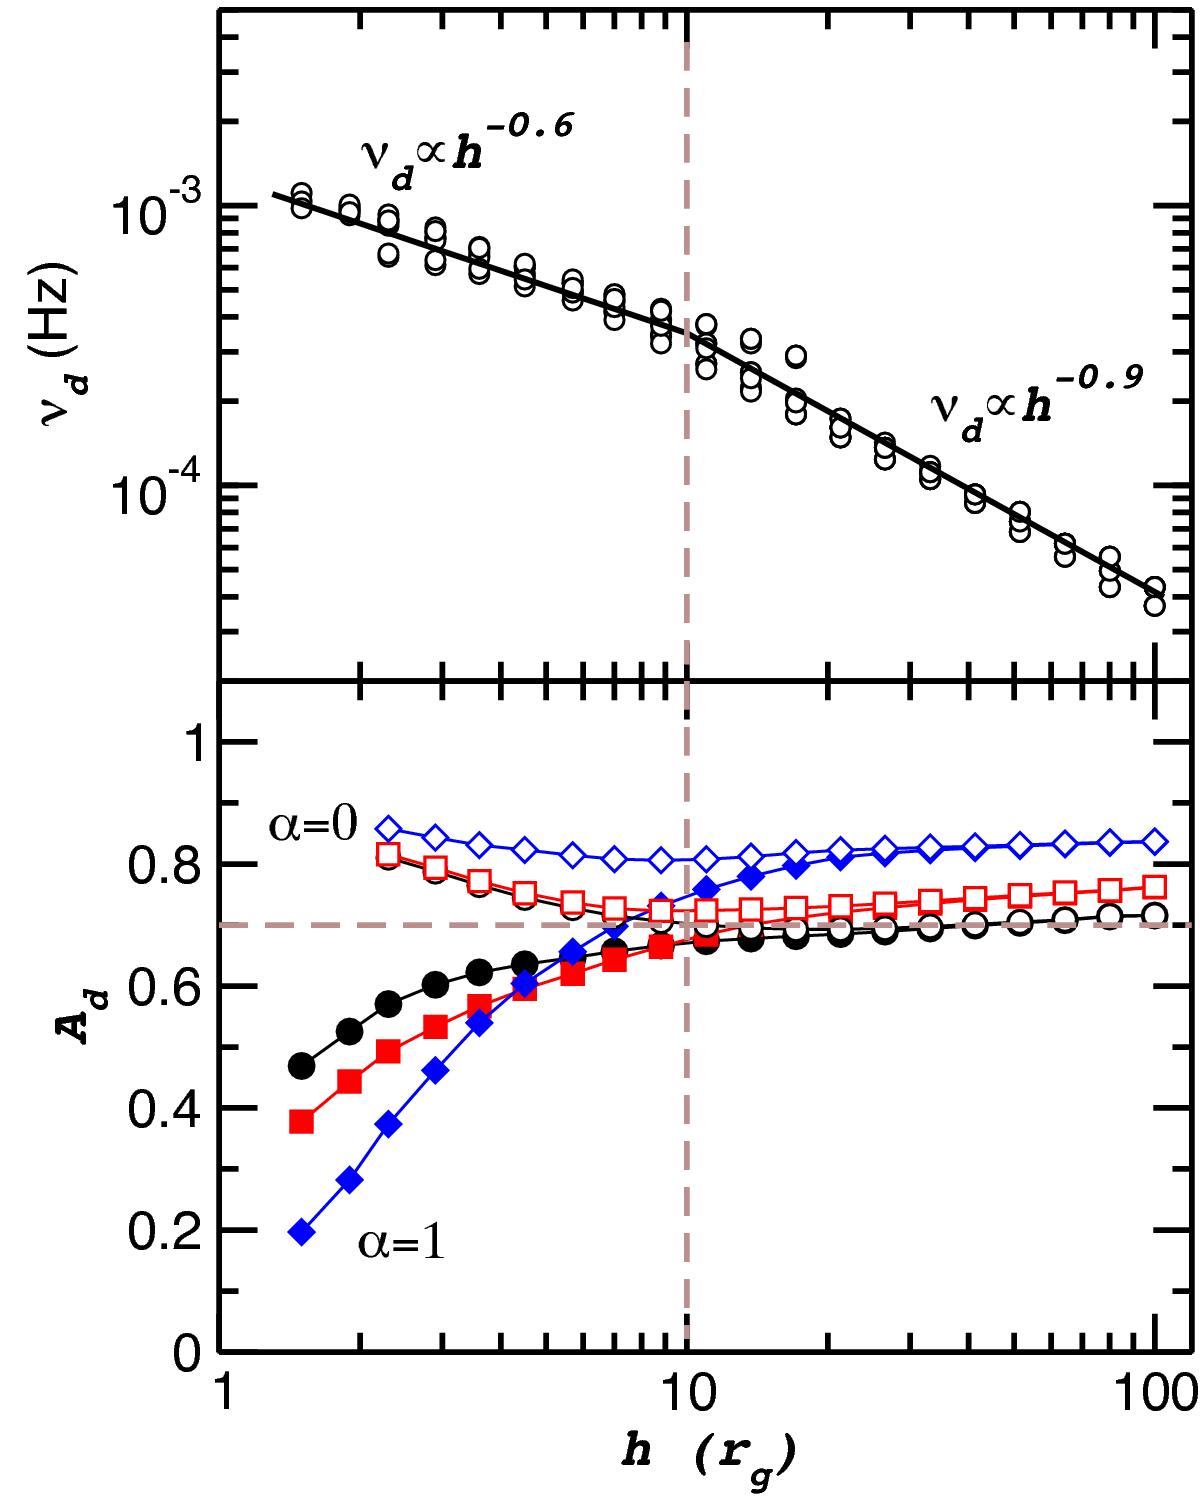
Frequency νd and amplitude Ad of the maximum depression of the first dip in the PSD ratios, plotted as a function of the source height (top and bottom panel, respectively). Open and filled points in the bottom panel indicate the data for the α = 0 and α = 1 case, respectively. Black, red, and blue points indicate the data for θ = 20,40, and 60 deg, respectively. The horizontal dashed line indicates the value Ad = 0.7.
Current usage metrics show cumulative count of Article Views (full-text article views including HTML views, PDF and ePub downloads, according to the available data) and Abstracts Views on Vision4Press platform.
Data correspond to usage on the plateform after 2015. The current usage metrics is available 48-96 hours after online publication and is updated daily on week days.
Initial download of the metrics may take a while.