Fig. A.3
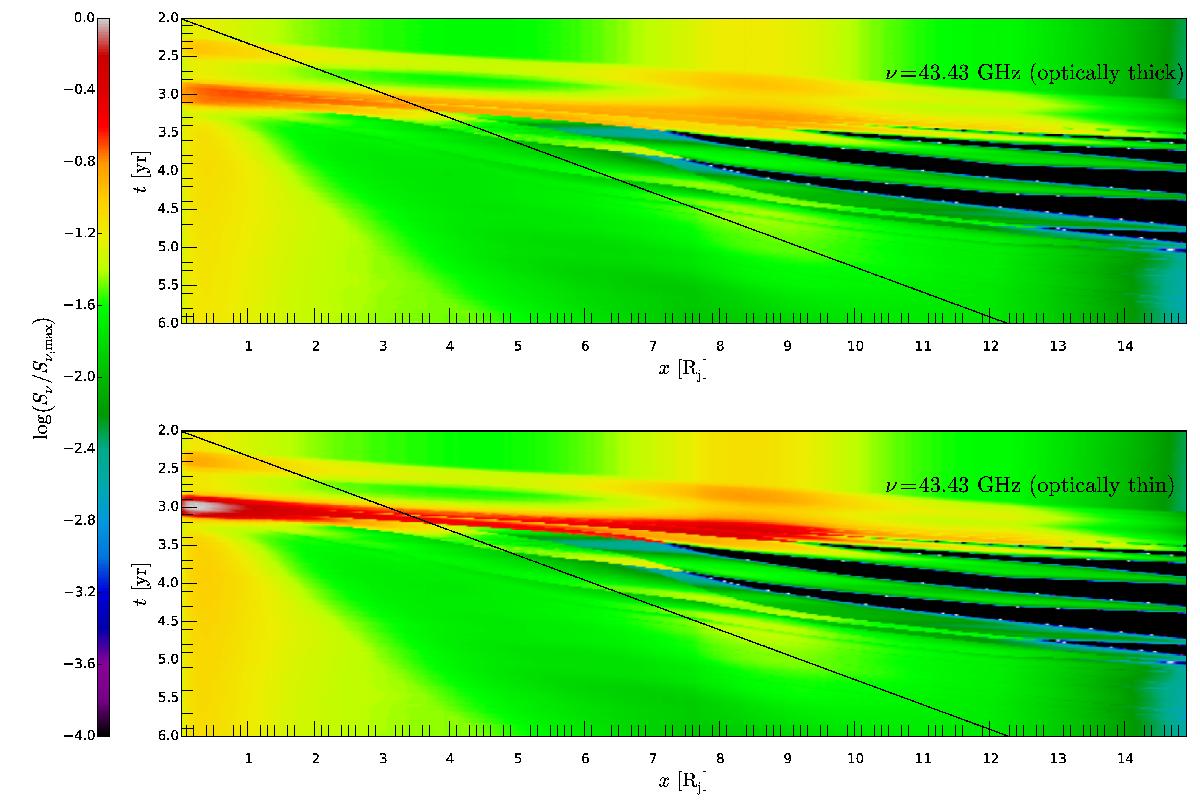
Time-space plot for the variation of the axial emission at 43 GHz for the OP jet in the observer’s frame at a viewing angle of 3°. The top panel shows the emission taking opacity effects into account, whereas the bottom panel shows the optically thin emission. The solid black line indicates propagation at the speed of light, so any structure that propagates with a flatter slope is superluminal. The emission values are normalized to their maximum value (given by the optically thin map).
Current usage metrics show cumulative count of Article Views (full-text article views including HTML views, PDF and ePub downloads, according to the available data) and Abstracts Views on Vision4Press platform.
Data correspond to usage on the plateform after 2015. The current usage metrics is available 48-96 hours after online publication and is updated daily on week days.
Initial download of the metrics may take a while.