Fig. A.1
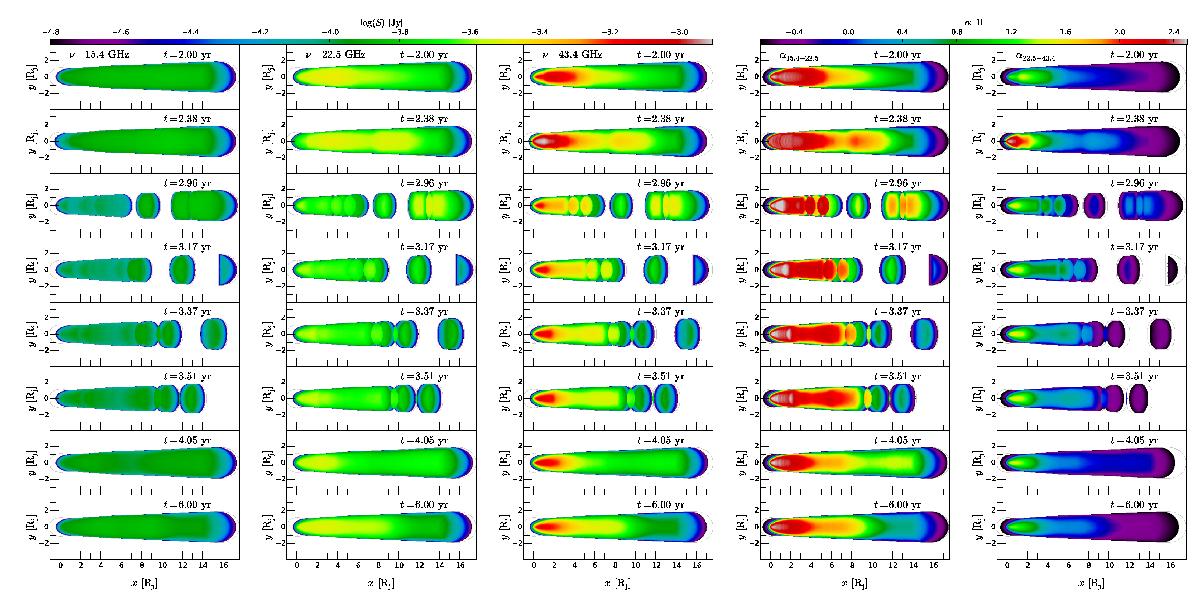
Synthetic observations of the PM jet at 15.4 GHz (first column), 22.4 GHz (second column), and 43.4 GHz (third column) seen at 3° observing angle for eight different epochs. The fourth and the fifth column on the right show the spectral index between the frequencies. The quiescent jet is shown in the first row, while the subsequent rows show the passage of the perturbation and the eventual reestablishment of the quiescent jet after the perturbation exists in the grid (last row).
Current usage metrics show cumulative count of Article Views (full-text article views including HTML views, PDF and ePub downloads, according to the available data) and Abstracts Views on Vision4Press platform.
Data correspond to usage on the plateform after 2015. The current usage metrics is available 48-96 hours after online publication and is updated daily on week days.
Initial download of the metrics may take a while.