Fig. 11
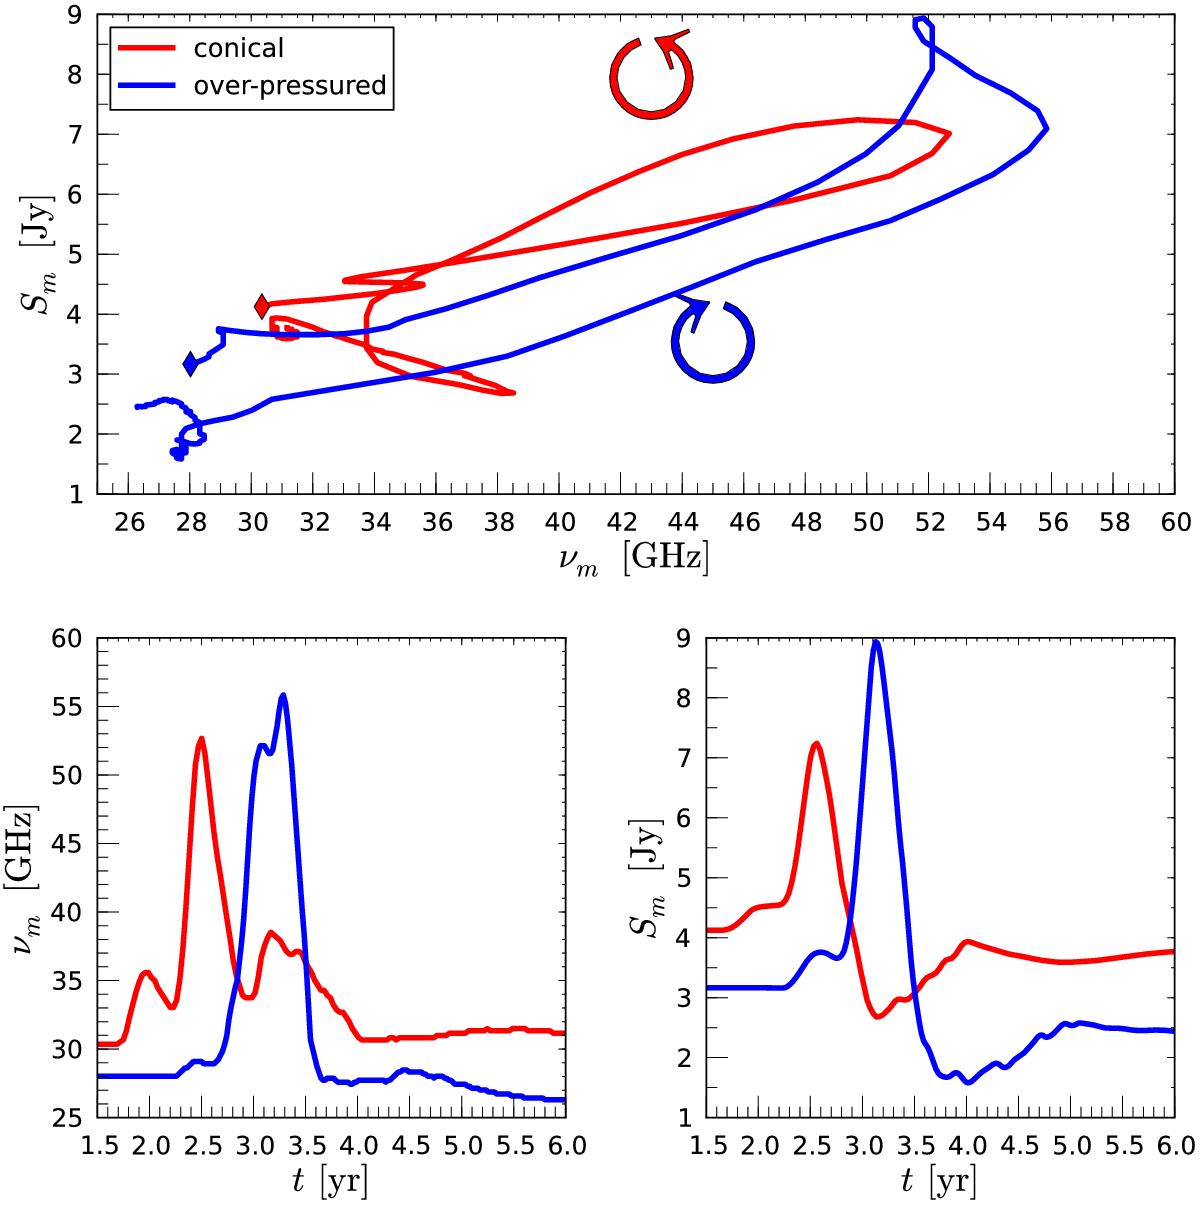
Evolution of the turnover values for the OP and PM jet. Top panel: evolution of the perturbation in the turnover frequency – turnover flux density (νm−Sm)-plane. The diamond marker indicates the start position of the flare and the temporal evolution is indicated with arrows. Bottom left: temporal evolution of the turnover frequency, νm. Bottom right: temporal evolution of the turnover flux density, Sm.
Current usage metrics show cumulative count of Article Views (full-text article views including HTML views, PDF and ePub downloads, according to the available data) and Abstracts Views on Vision4Press platform.
Data correspond to usage on the plateform after 2015. The current usage metrics is available 48-96 hours after online publication and is updated daily on week days.
Initial download of the metrics may take a while.