Fig. 8
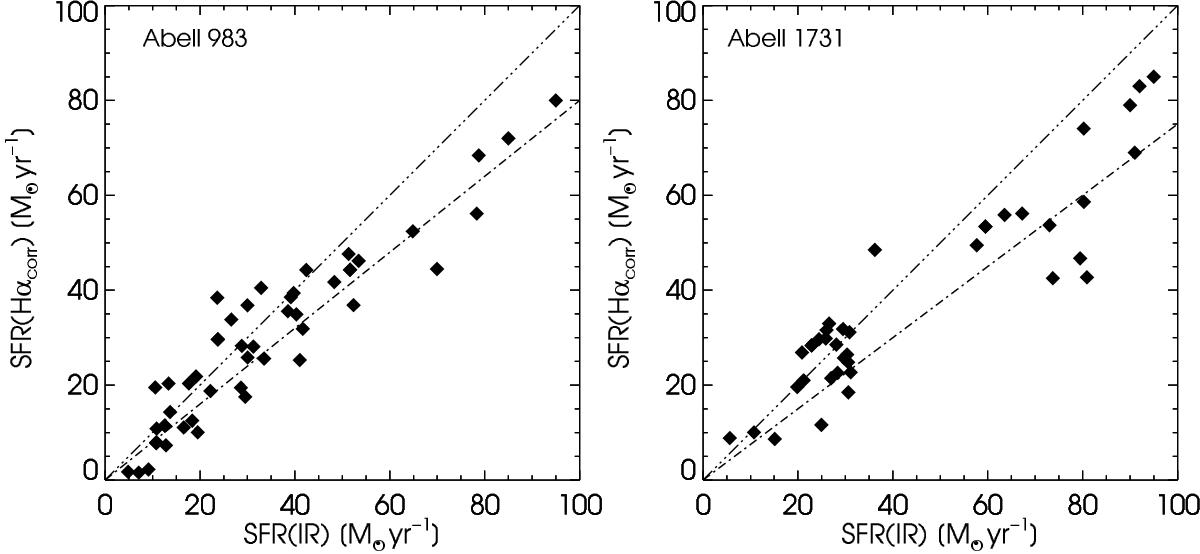
Comparison of SFR evaluated from the extinction-corrected Hα line flux and the SFR based on the total IR luminosity obtained from the SED fit. The triple-dot-dash line corresponds to the relation with slope m = 1. The dot-dashed line corresponds to the linear fit of the data. (m = 0.8 ± 0.02 and m = 0.74 ± 0.06 for A983 and A1731, respectively). The left and right panels refer to A983 and 1731, respectively.
Current usage metrics show cumulative count of Article Views (full-text article views including HTML views, PDF and ePub downloads, according to the available data) and Abstracts Views on Vision4Press platform.
Data correspond to usage on the plateform after 2015. The current usage metrics is available 48-96 hours after online publication and is updated daily on week days.
Initial download of the metrics may take a while.