Fig. 6
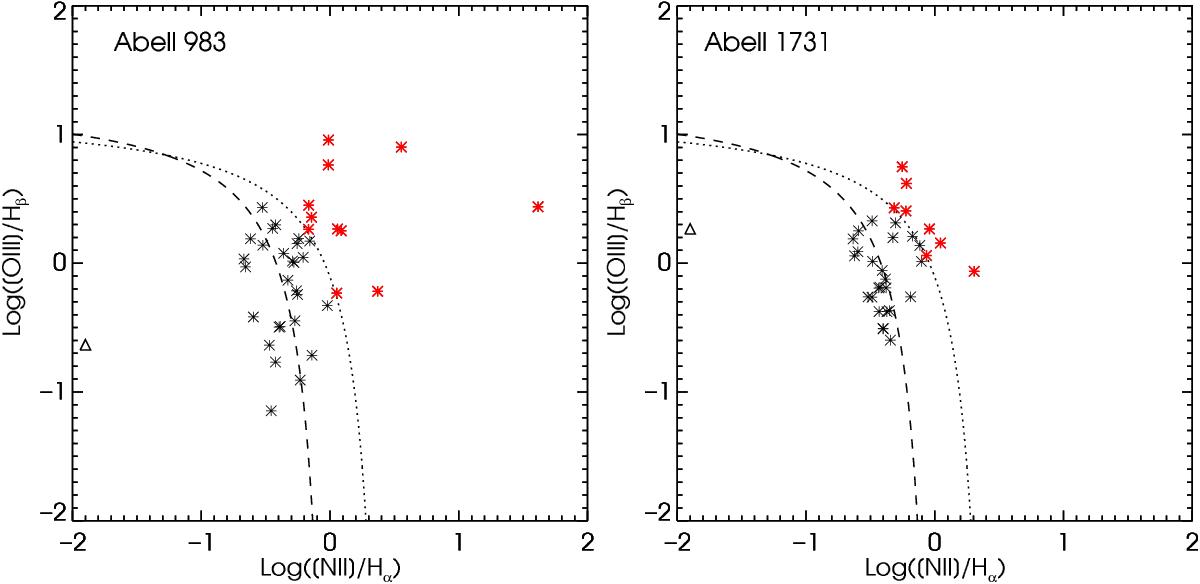
Emission line diagnostic diagrams using [NII] /Hα and [OIII] /Hβ line ratios for A983 and A1731 in the left and right panel, respectively. The dotted line separates the HII star-forming regions, below, from the AGN, above, following the modelling by Kewley et al. (2001). The selected AGN candidates are plotted as red asterisks. The triangle identifies the source without and [NII] emission lines. As a comparison, we also plotted the Kauffmann et al. (2003) cut as dashed line, that selects less fiercely star-forming galaxies.
Current usage metrics show cumulative count of Article Views (full-text article views including HTML views, PDF and ePub downloads, according to the available data) and Abstracts Views on Vision4Press platform.
Data correspond to usage on the plateform after 2015. The current usage metrics is available 48-96 hours after online publication and is updated daily on week days.
Initial download of the metrics may take a while.