Free Access
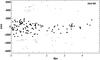
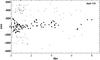
Fig. 5

Observed galaxies with a spectroscopic redshift in the range 0.15 <z< 0.25, plotted in the clustercentric distance-velocity space. The filled dots correspond to the cluster members selected with the shifting gap method by Fadda et al. (1996). The right and left panels correspond to A983 and 1731, respectively.
This figure is made of several images, please see below:
Current usage metrics show cumulative count of Article Views (full-text article views including HTML views, PDF and ePub downloads, according to the available data) and Abstracts Views on Vision4Press platform.
Data correspond to usage on the plateform after 2015. The current usage metrics is available 48-96 hours after online publication and is updated daily on week days.
Initial download of the metrics may take a while.