Free Access
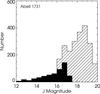
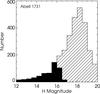
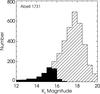
Fig. 3
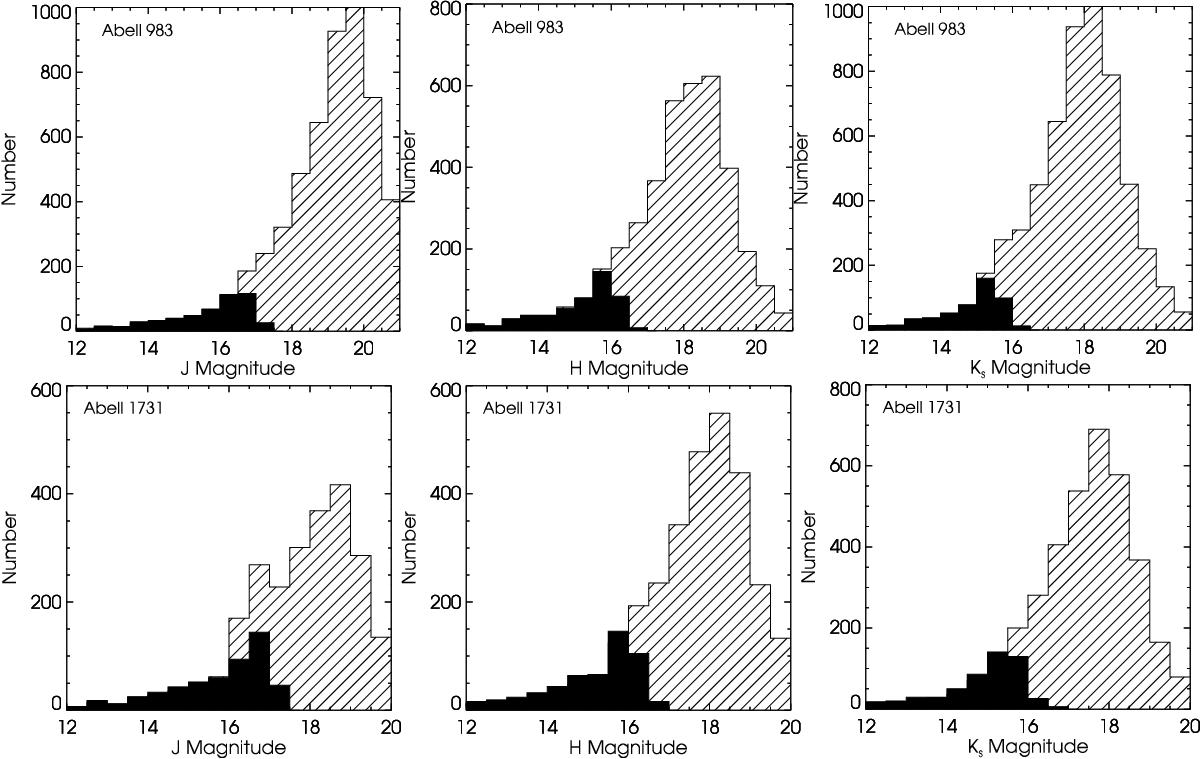
WIRC J, H, Ks number counts for A983 (top) and A1731 (bottom). The histograms show the number of sources per bin of magnitudes J, H, and Ksfrom left to right, respectively. The overplotted filled histograms show the depth of the archival 2MASS data in the same region of the sky covered by the WIRC observations.
This figure is made of several images, please see below:
Current usage metrics show cumulative count of Article Views (full-text article views including HTML views, PDF and ePub downloads, according to the available data) and Abstracts Views on Vision4Press platform.
Data correspond to usage on the plateform after 2015. The current usage metrics is available 48-96 hours after online publication and is updated daily on week days.
Initial download of the metrics may take a while.