Fig. 2
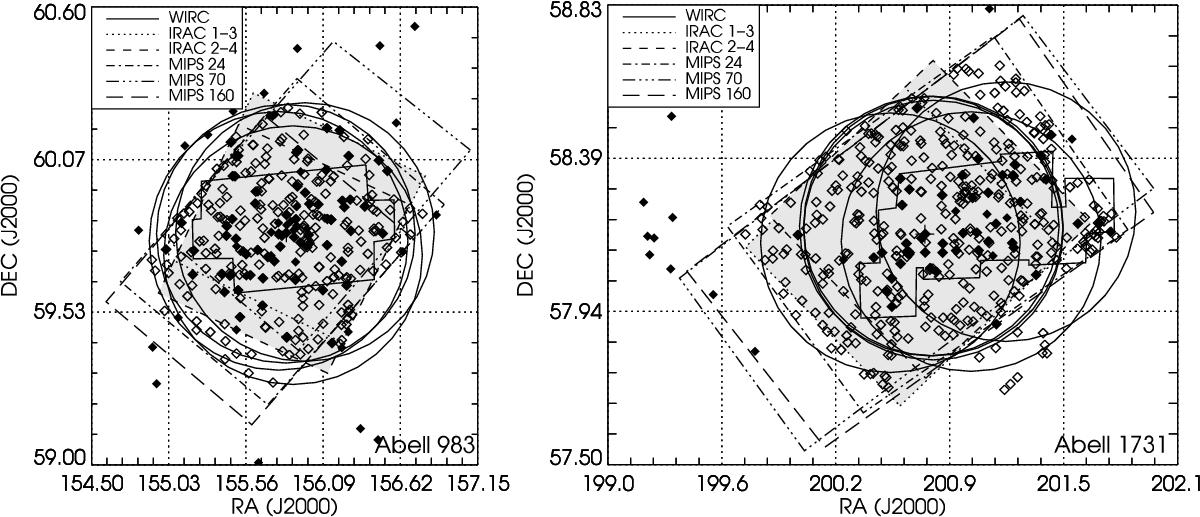
Coverage of IR and optical data for A983 (left panel) and A1731 (right panel). The open and filled diamonds correspond to the HYDRA observed targets and the spectroscopically confirmed members, respectively. The solid line polygon delineates the WIRC observations. The shaded region marks the IRAC fields. The 3.6 and 5.8 μm data are outlined with a dotted line, and the 4.5 and 8.0 μm data are outlined with a dashed line. The footprints of the MIPS 24 μm, 70 μm and 160 μm fields are delimited by the dot-dashed, dash-triple dot, and long dashed lines, respectively. The large circles indicates the WIYN/Hydra field of view.
Current usage metrics show cumulative count of Article Views (full-text article views including HTML views, PDF and ePub downloads, according to the available data) and Abstracts Views on Vision4Press platform.
Data correspond to usage on the plateform after 2015. The current usage metrics is available 48-96 hours after online publication and is updated daily on week days.
Initial download of the metrics may take a while.