Free Access
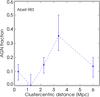
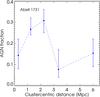
Fig. 15
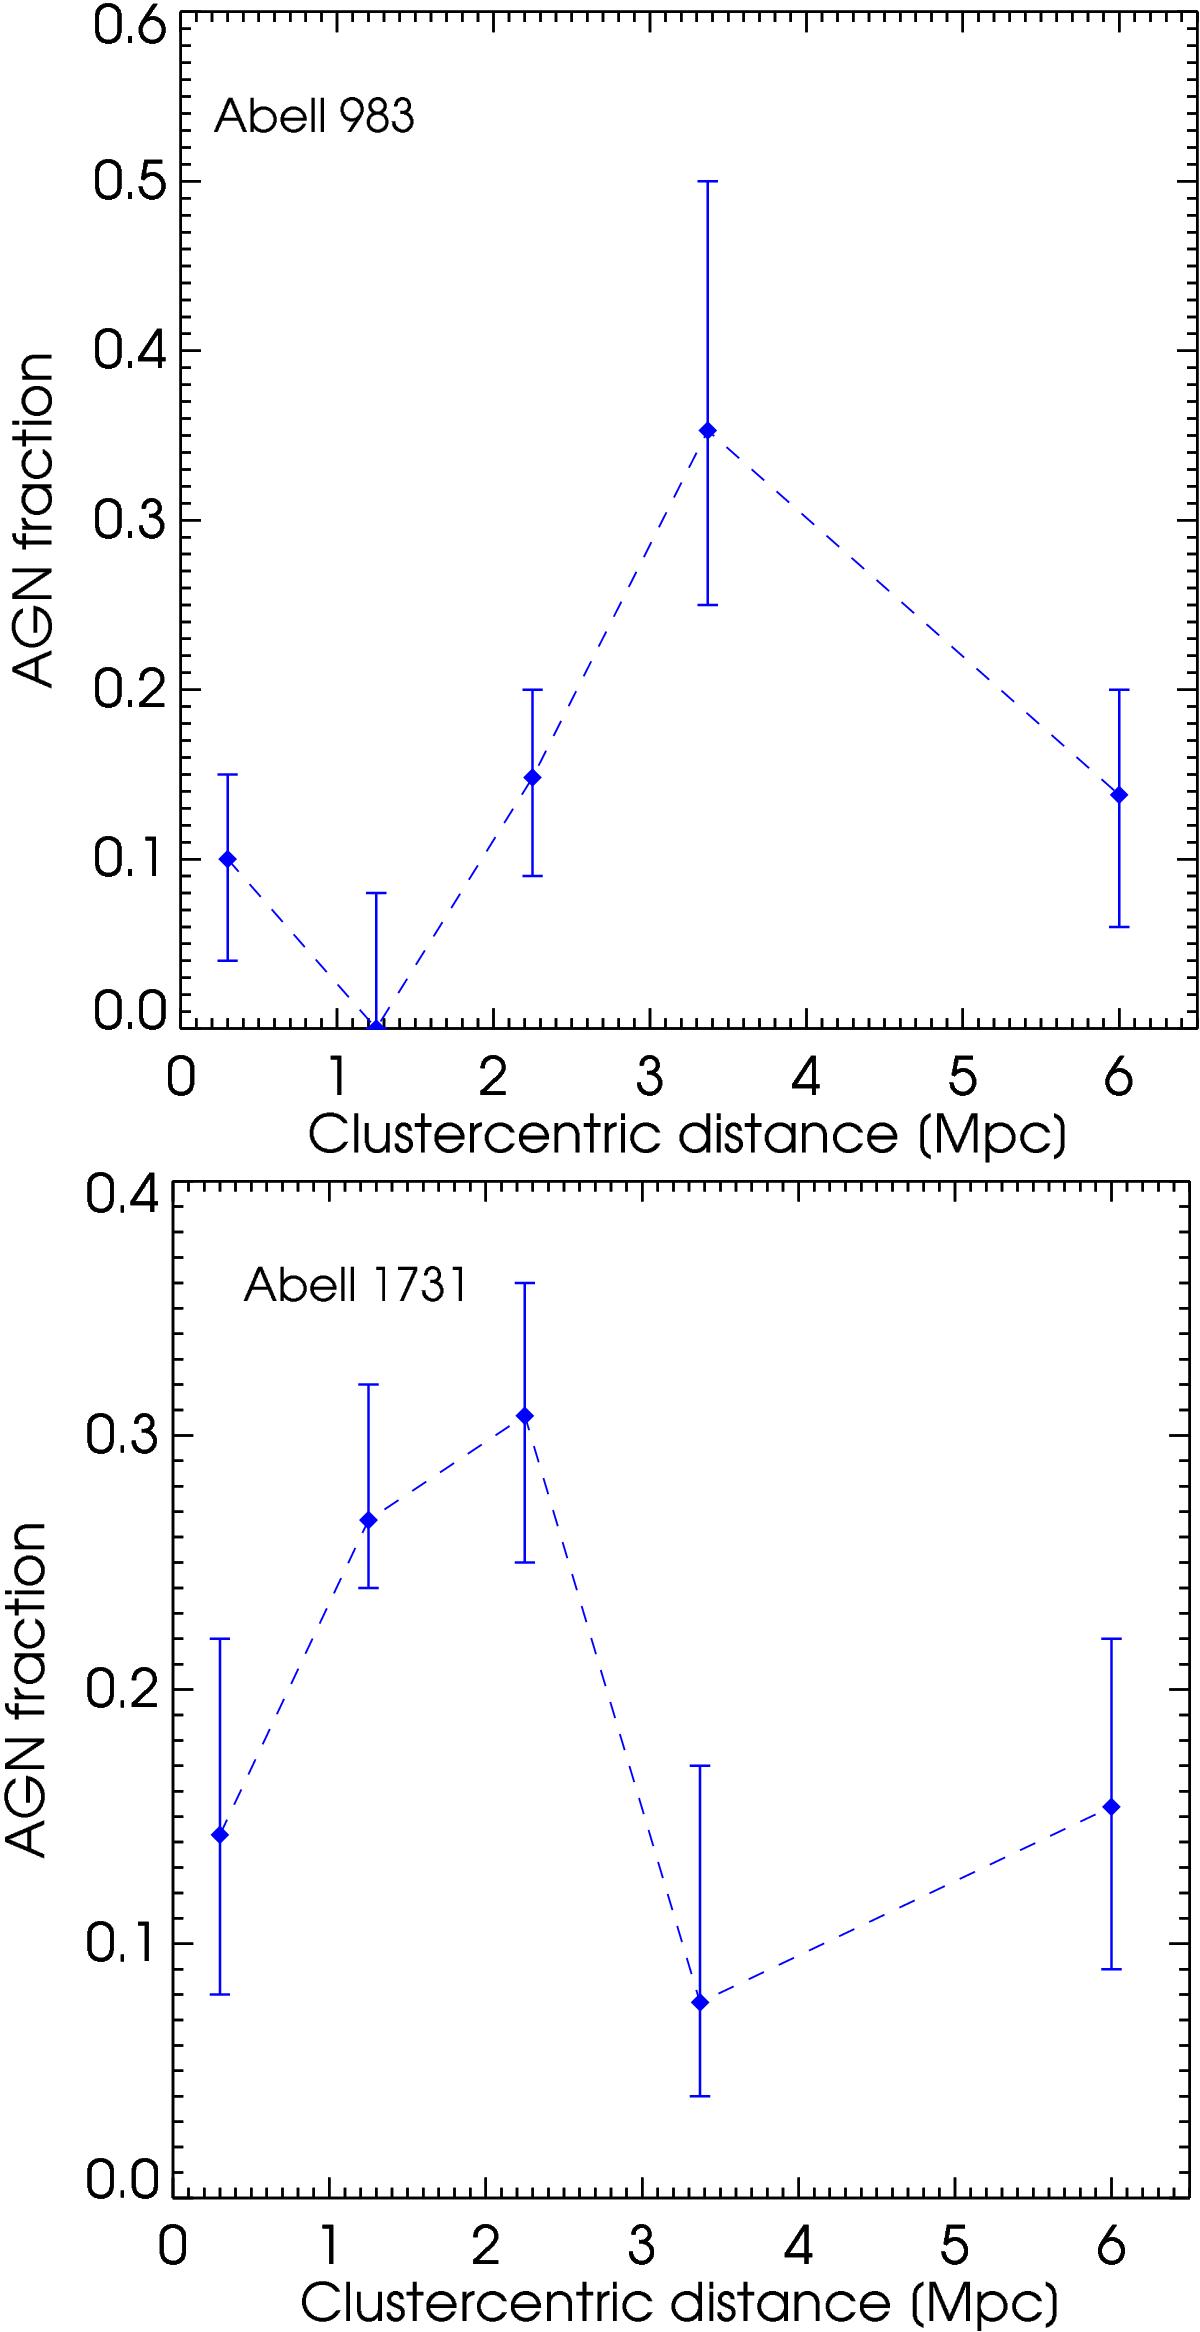
Radially binned 1D distribution of the AGN fraction plotted against the clustercentric distance, for A983 (left panel) and A1731 (right panel). The errorbars are computed using the bootstrap method.
This figure is made of several images, please see below:
Current usage metrics show cumulative count of Article Views (full-text article views including HTML views, PDF and ePub downloads, according to the available data) and Abstracts Views on Vision4Press platform.
Data correspond to usage on the plateform after 2015. The current usage metrics is available 48-96 hours after online publication and is updated daily on week days.
Initial download of the metrics may take a while.