Fig. 14
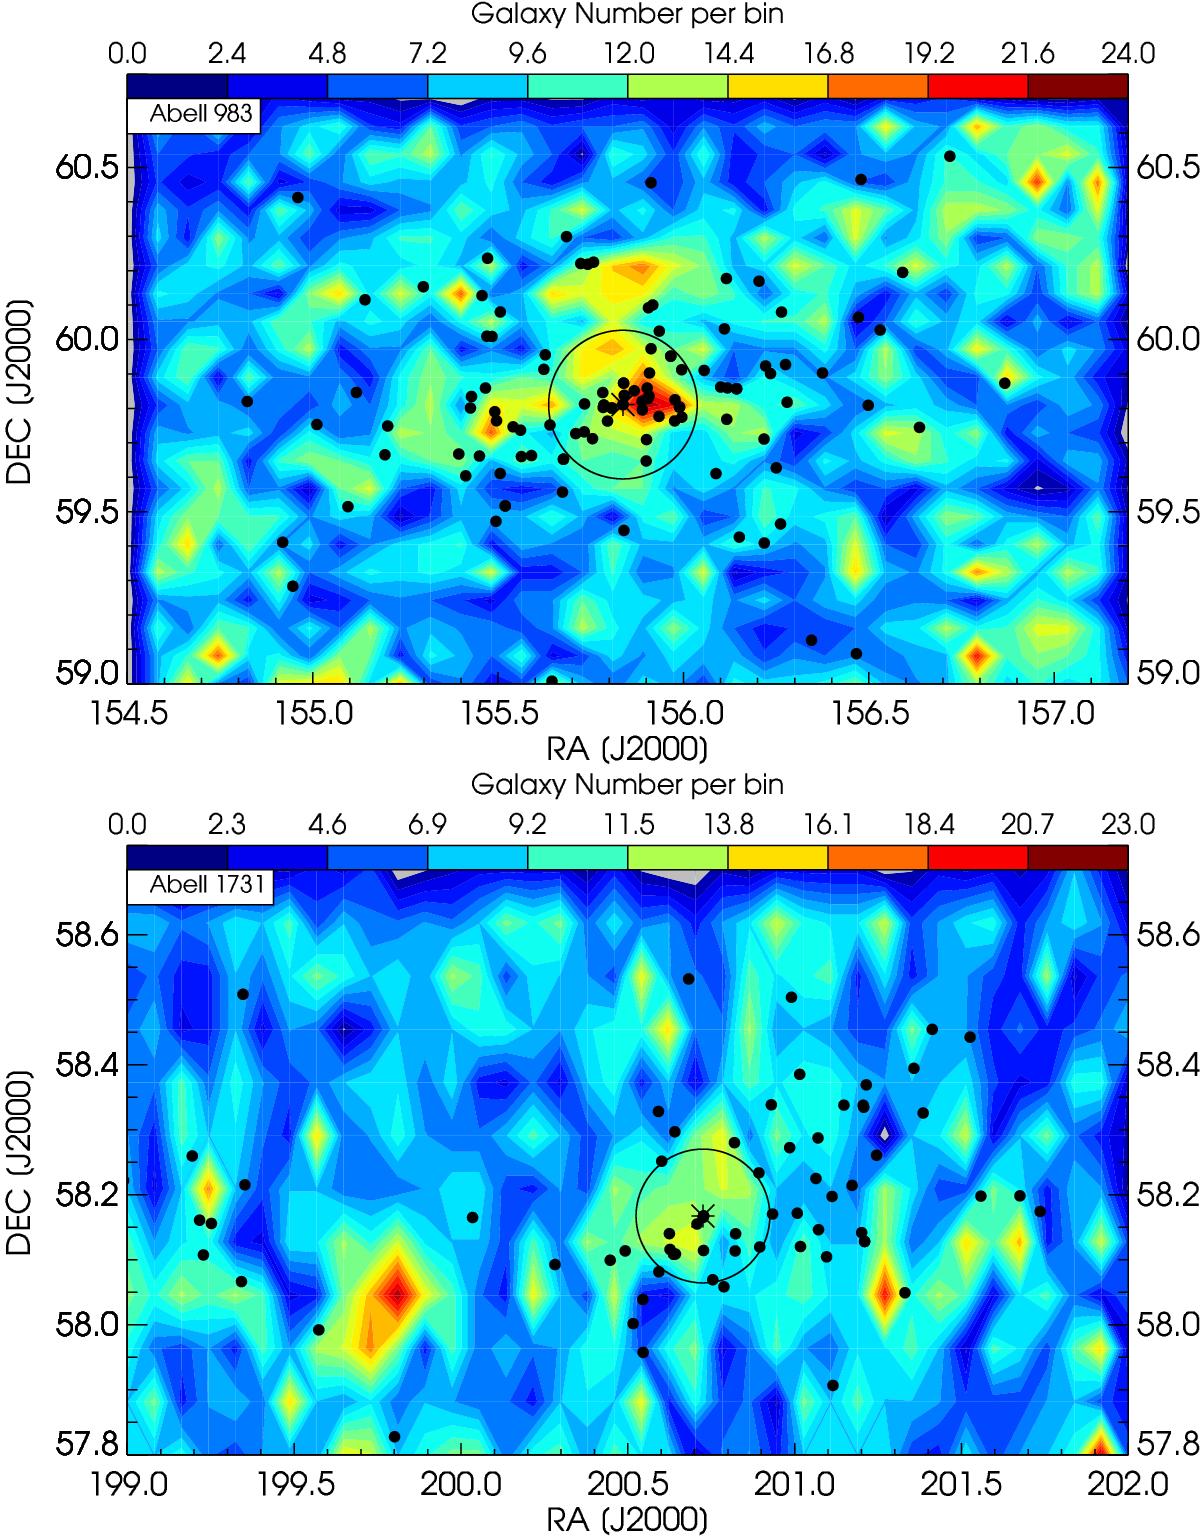
2D density distribution of the passive galaxies vs. the dynamical centre of the clusters (plotted as an asterisk). The spectroscopically confirmed members are overplotted as black circles. The panels for A983 and 1731 are the top and bottom one, respectively. The open cirle represents 1.3 Mpc distance from the cluster center.
Current usage metrics show cumulative count of Article Views (full-text article views including HTML views, PDF and ePub downloads, according to the available data) and Abstracts Views on Vision4Press platform.
Data correspond to usage on the plateform after 2015. The current usage metrics is available 48-96 hours after online publication and is updated daily on week days.
Initial download of the metrics may take a while.