Free Access
Fig. 13
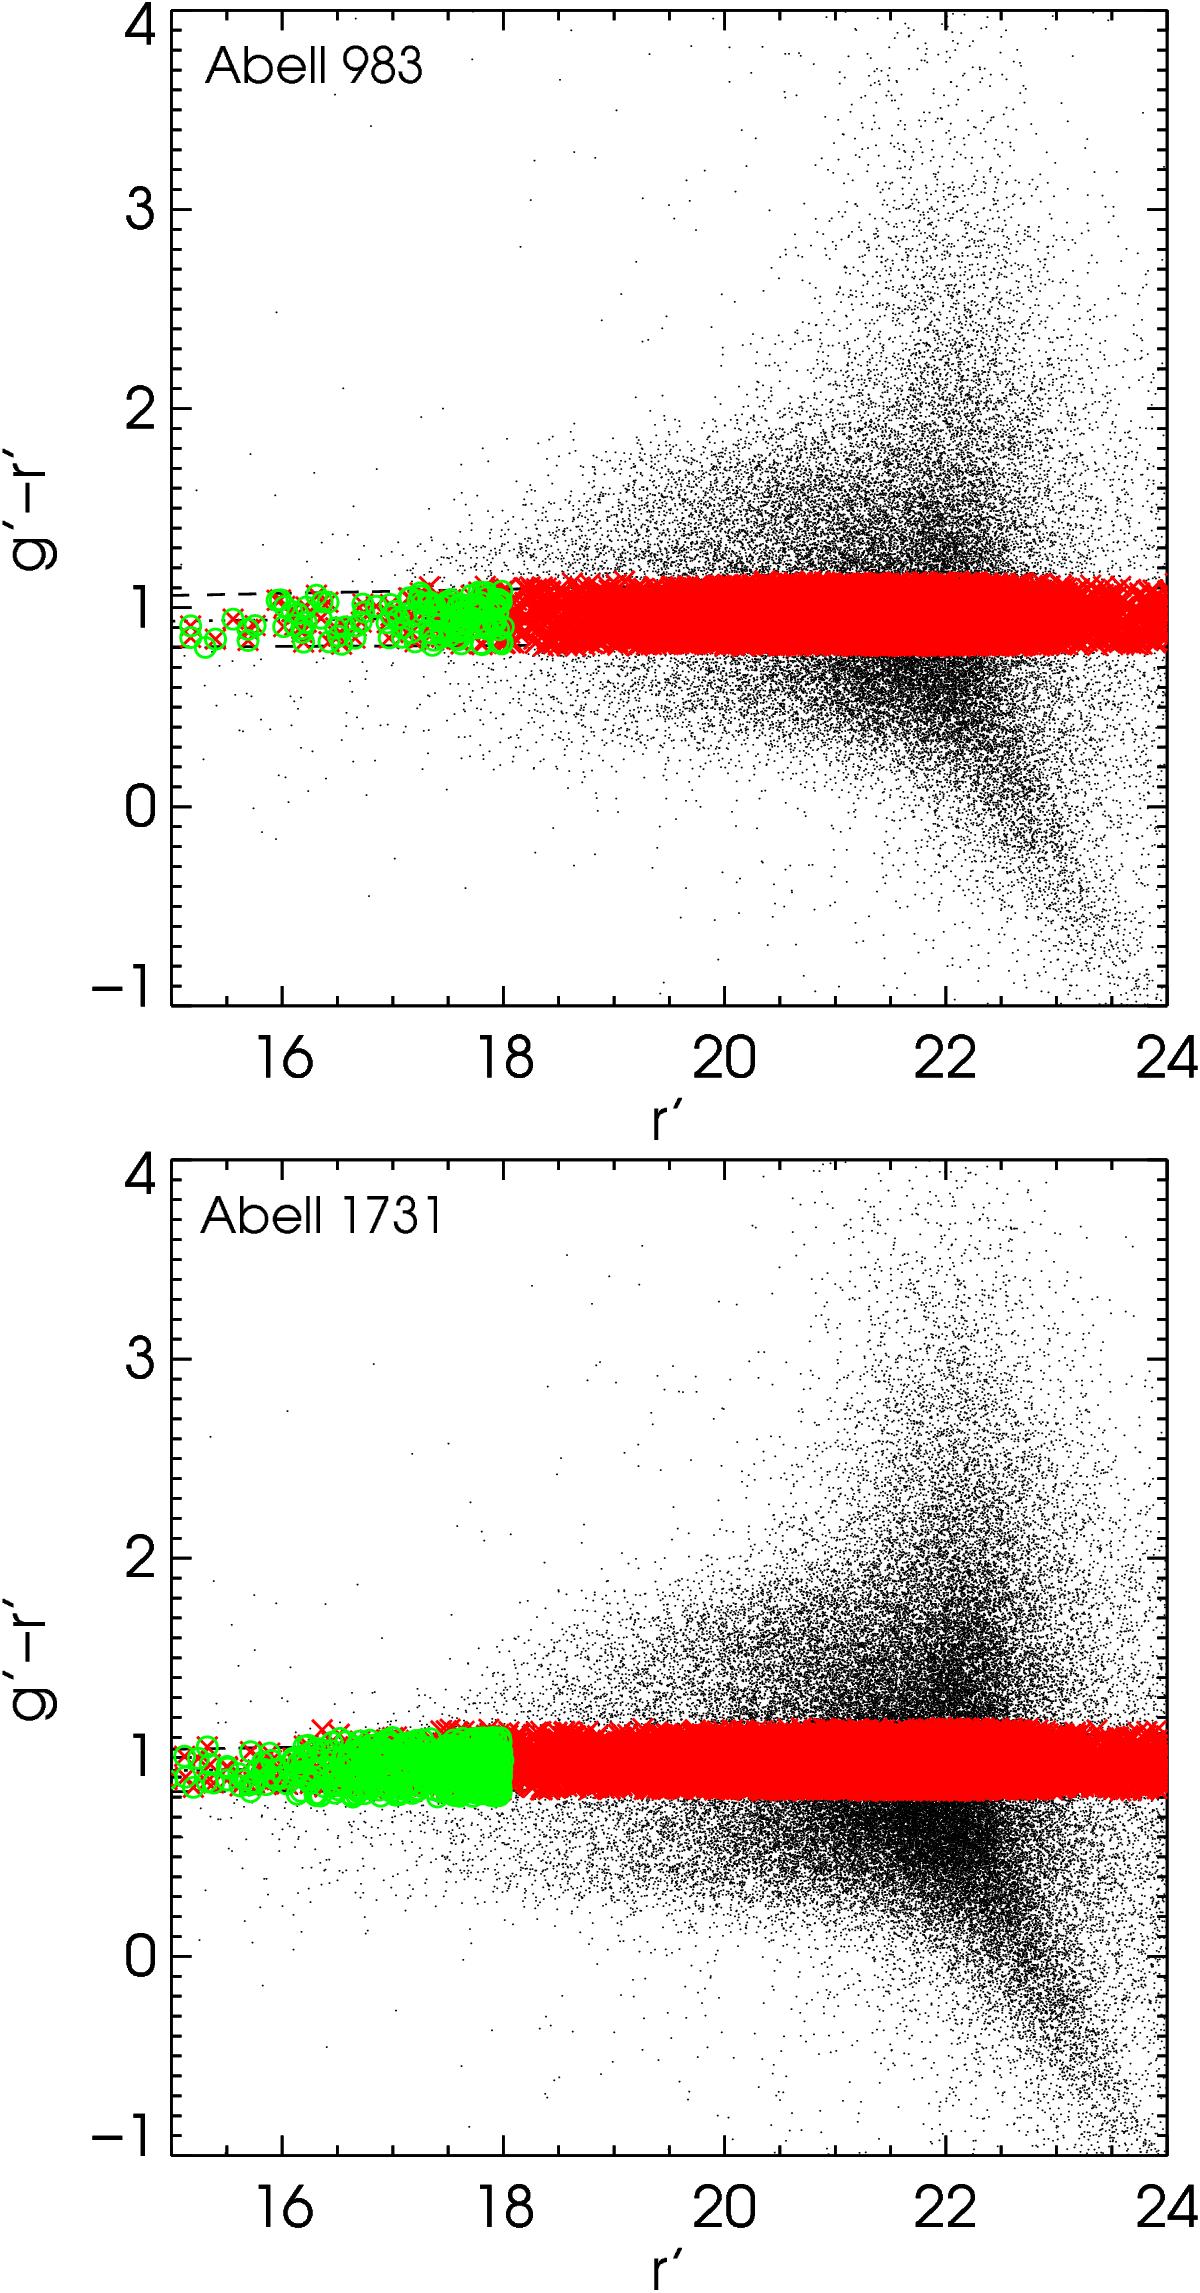
Colour-magnitude diagram of the cluster A983 (top panel) and 1731 (bottom panel). The galaxies belonging to the red sequence are indicated with red crosses. The subsample of the galaxies used for the red-sequence selection is visible as green circles.
This figure is made of several images, please see below:
Current usage metrics show cumulative count of Article Views (full-text article views including HTML views, PDF and ePub downloads, according to the available data) and Abstracts Views on Vision4Press platform.
Data correspond to usage on the plateform after 2015. The current usage metrics is available 48-96 hours after online publication and is updated daily on week days.
Initial download of the metrics may take a while.