Free Access
Fig. 12
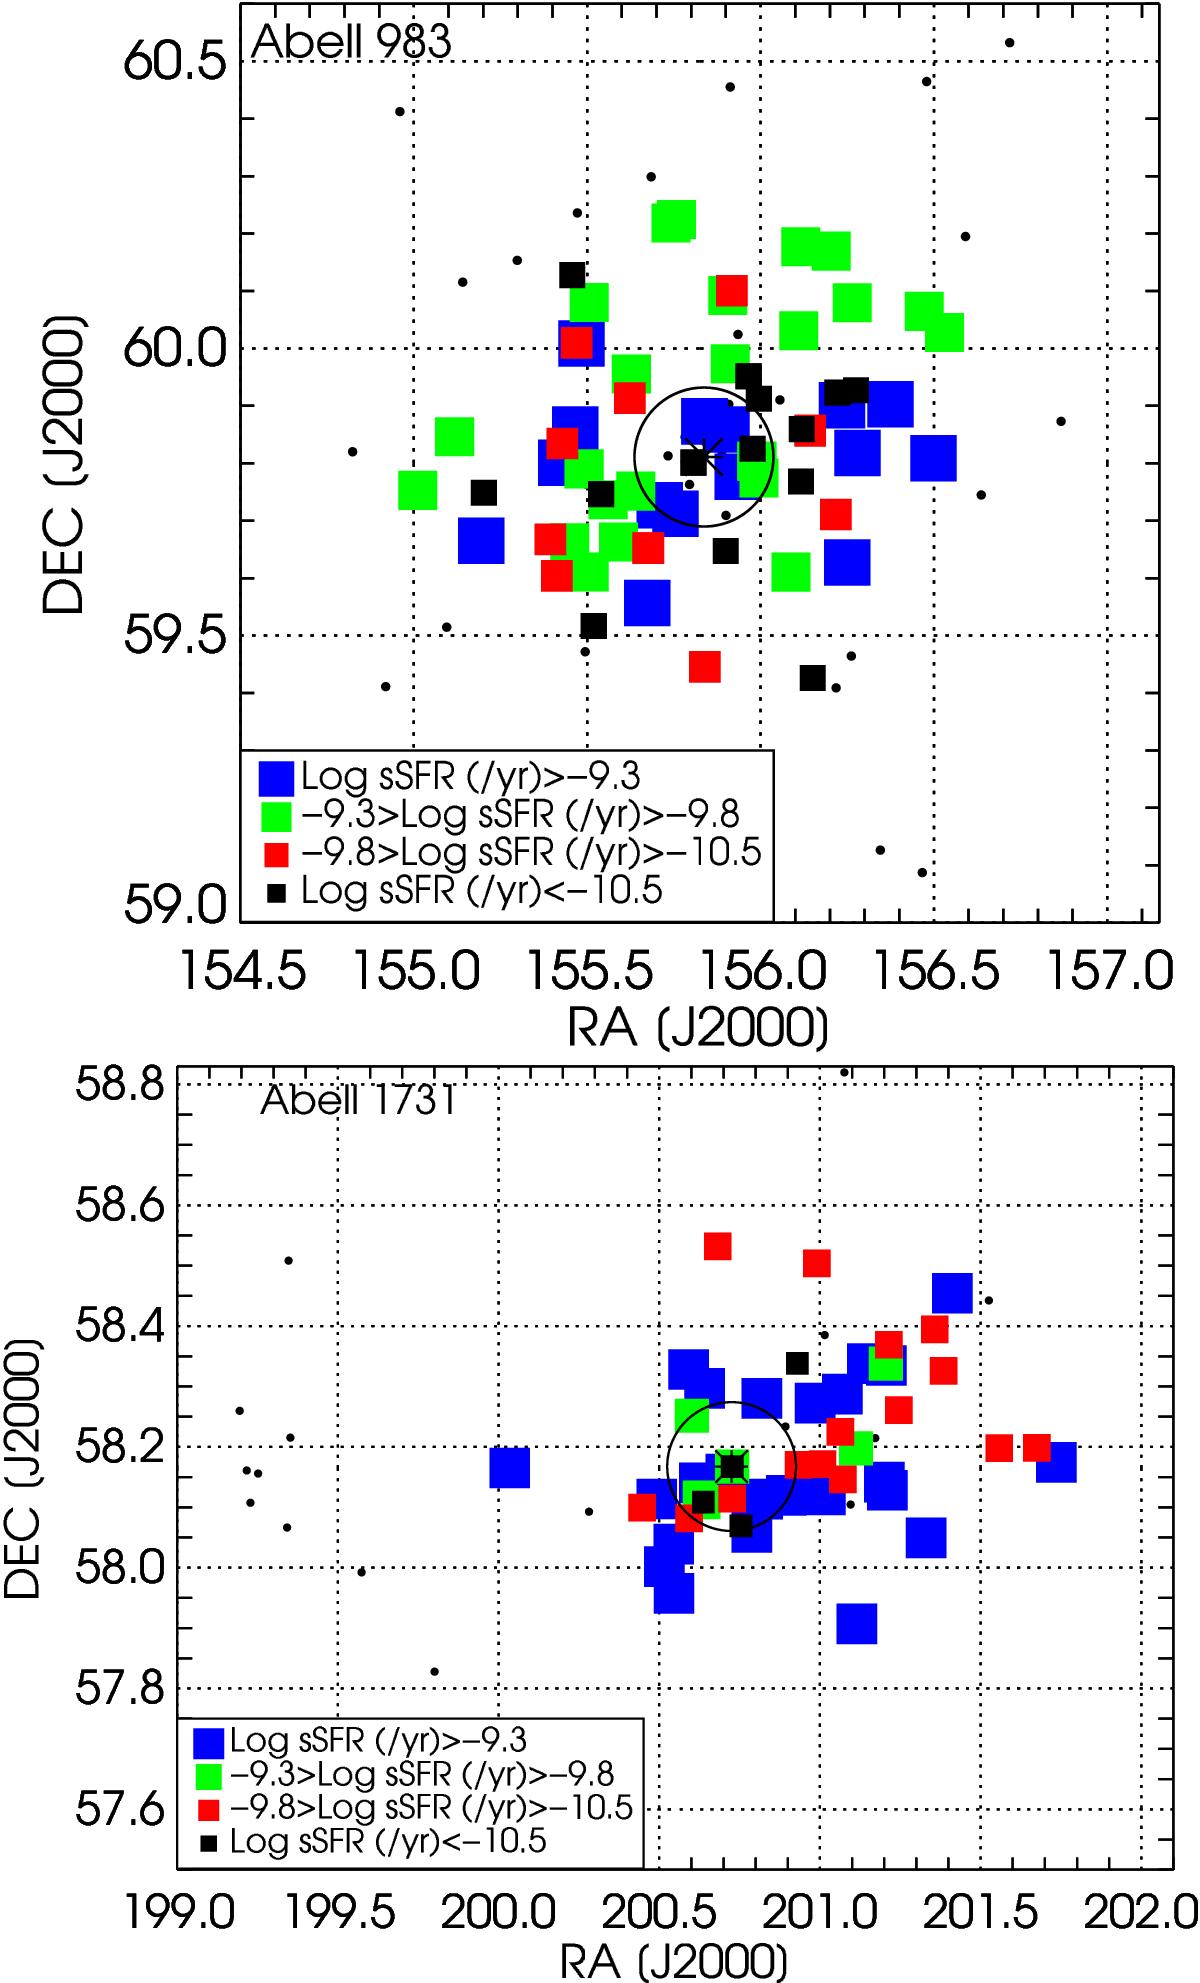
2D distribution of the sSFR of the members in the central region of A983 (top) and A1731 (bottom). The black dots indicate the members for which no star formation was measured. The BCG is marked as an asterisk and the open cirle represents 1.3 Mpc distance from the cluster centre.
This figure is made of several images, please see below:
Current usage metrics show cumulative count of Article Views (full-text article views including HTML views, PDF and ePub downloads, according to the available data) and Abstracts Views on Vision4Press platform.
Data correspond to usage on the plateform after 2015. The current usage metrics is available 48-96 hours after online publication and is updated daily on week days.
Initial download of the metrics may take a while.