Fig. 10
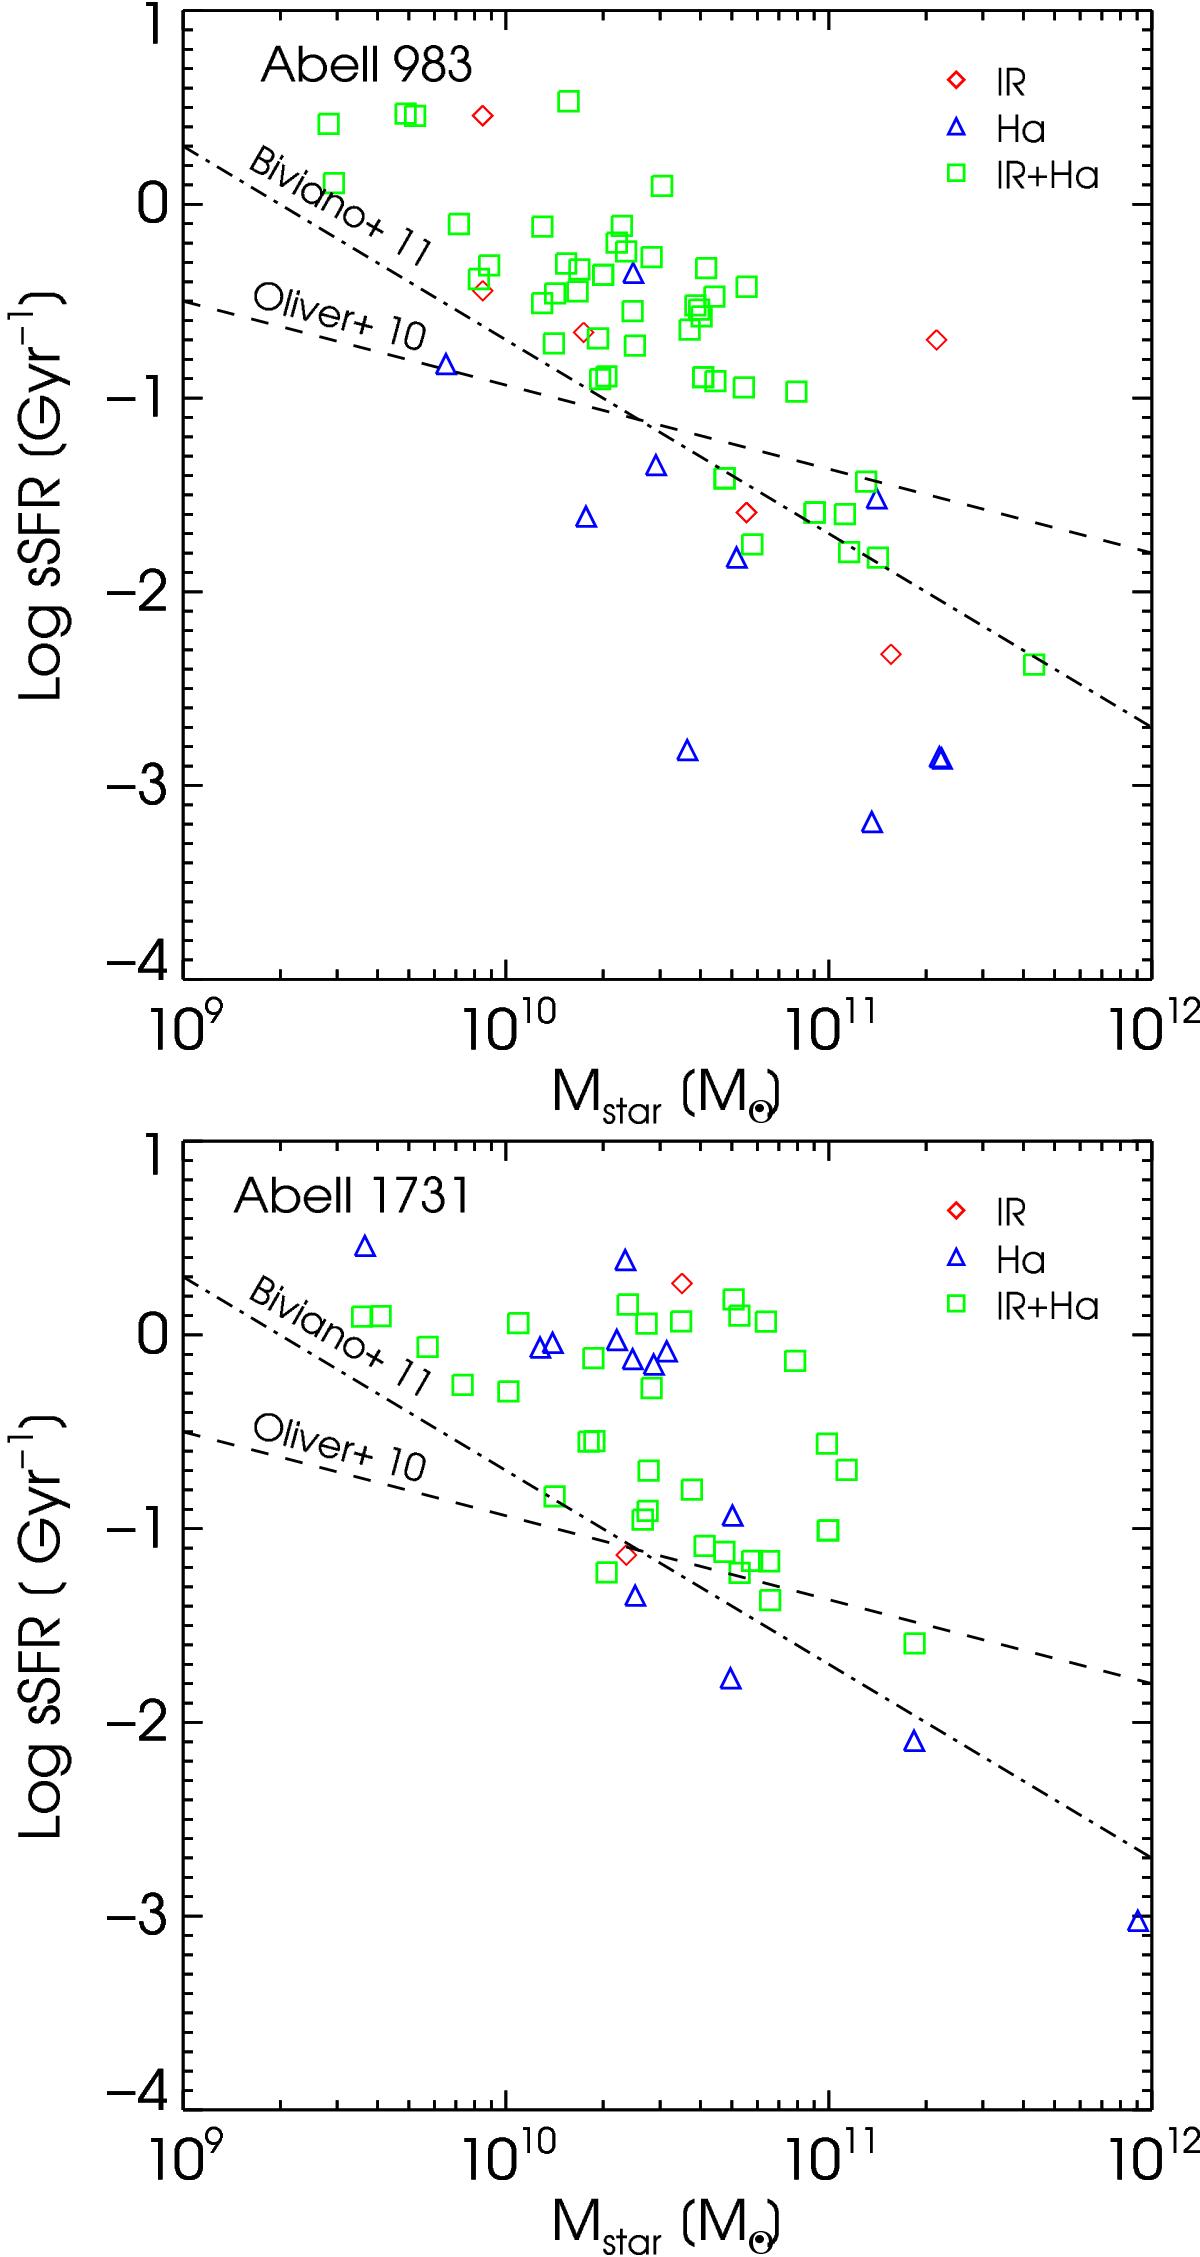
sSFR of the cluster members. The dot-dashed line represents the expected sSFR vs. M∗ relation for a 24 μm source of 0.2 mJy flux density (i.e. at the completeness limit of our Spitzer observations), obtained in Biviano et al. (2011) using the relations of Lee et al. (2010) and Kennicutt (1998). The dashed line corresponds to the relation of Oliver et al. (2010) for galaxies from the Spitzer Wide-area InfraRed Extragalactic Legacy Survey in the redshift range 0.2 <z< 0.3. The galaxies in A983 and 1731 are plotted in the top and bottom panels, respectively.
Current usage metrics show cumulative count of Article Views (full-text article views including HTML views, PDF and ePub downloads, according to the available data) and Abstracts Views on Vision4Press platform.
Data correspond to usage on the plateform after 2015. The current usage metrics is available 48-96 hours after online publication and is updated daily on week days.
Initial download of the metrics may take a while.