Fig. 6
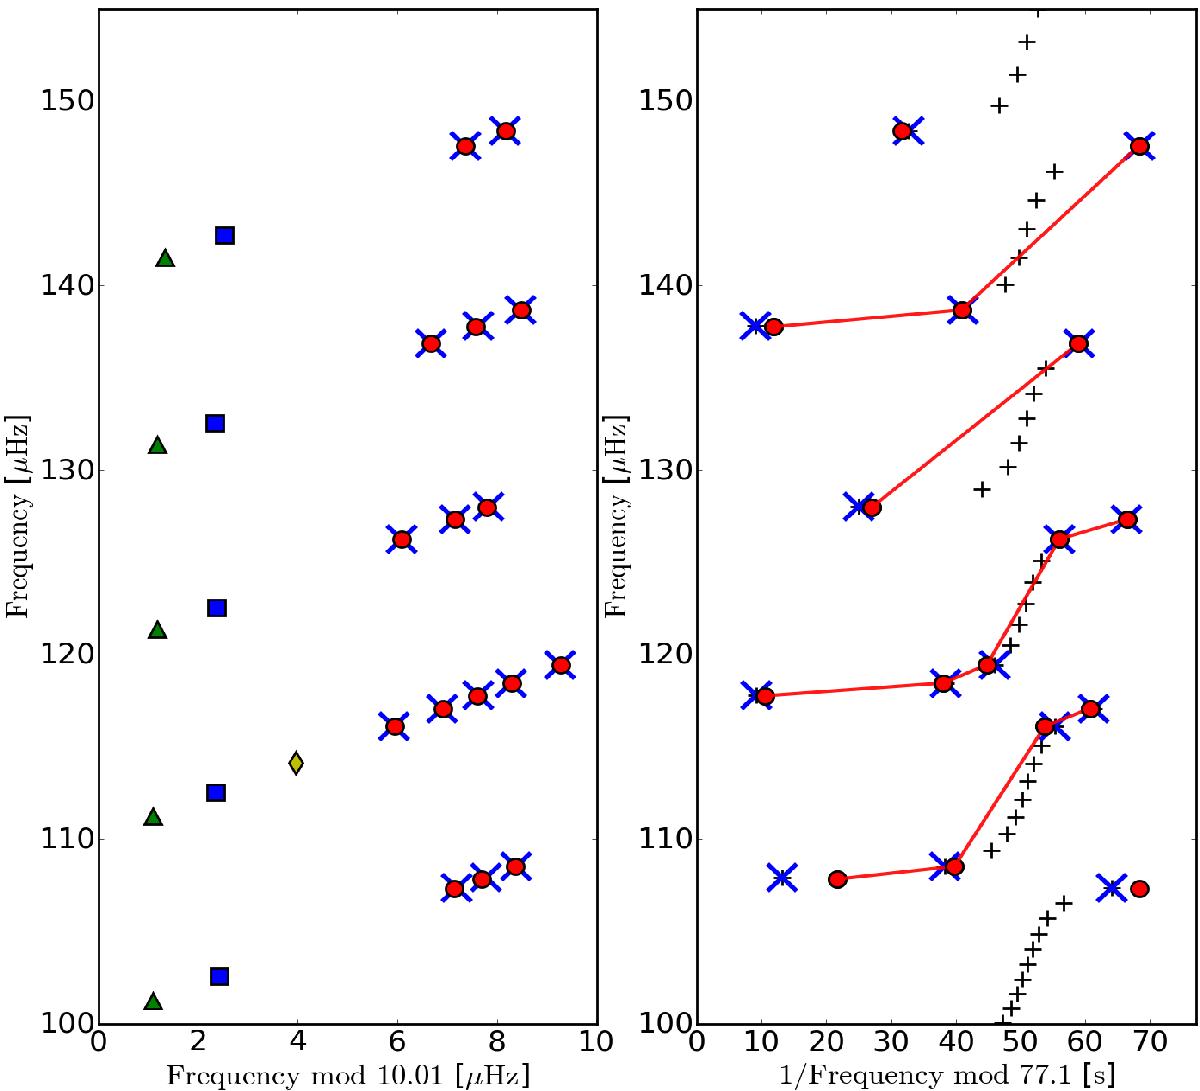
Échelle diagrams comparing the solution of the asymptotic relation (ΔΠ1,asym = 77.1 s, q = 0.11 and ϵg = 0.16) with extracted modes for KIC 6928997. Left: a frequency échelle diagram, comparing the frequencies of the asymptotic relation to those from the mode extraction. The extracted radial, dipole, quadrupole, and octupole modes are indicated by blue squares, red dots, green triangles, and yellow diamonds, respectively. The frequencies of the dipole mixed modes obtained from the asymptotic relation, and having an observational counterpart, are indicated by blue crosses. Right: a period échelle spectrum for the dipole modes, showing the same comparison as in the left panel with the same color coding. The black “+” indicate the frequencies for the mixed modes obtained from the asymptotic relation without any observational counterparts.
Current usage metrics show cumulative count of Article Views (full-text article views including HTML views, PDF and ePub downloads, according to the available data) and Abstracts Views on Vision4Press platform.
Data correspond to usage on the plateform after 2015. The current usage metrics is available 48-96 hours after online publication and is updated daily on week days.
Initial download of the metrics may take a while.