Fig. 3
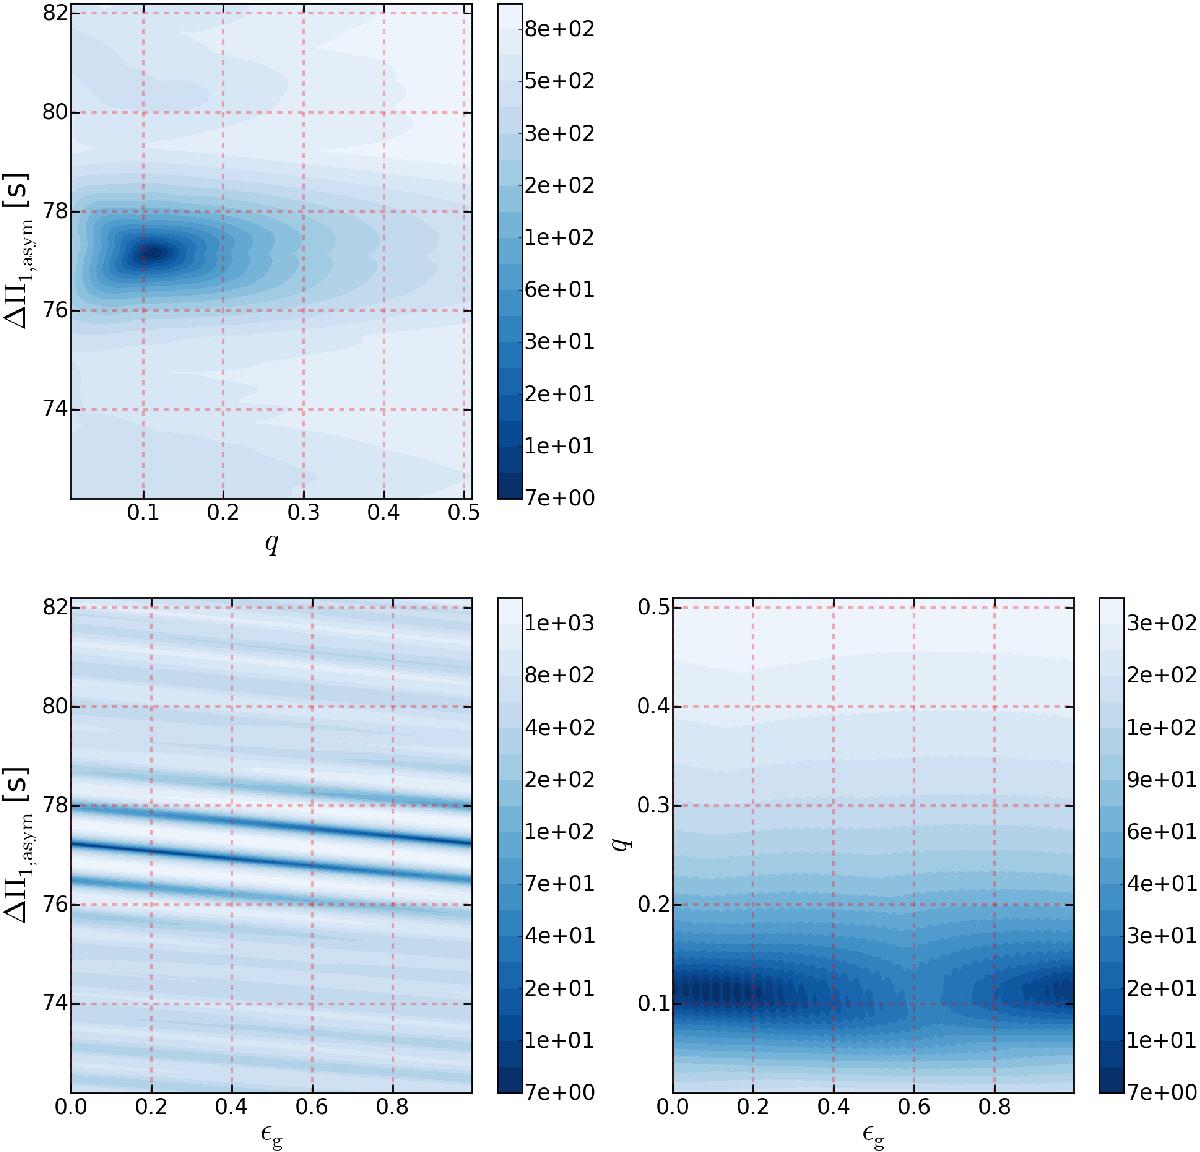
Correlation maps indicating the ![]() as a color map for KIC 6928997, as deduced from the asymptotic relation Eq. (17). The one-dimensional marginal distributions are given in Fig. A.5. The
as a color map for KIC 6928997, as deduced from the asymptotic relation Eq. (17). The one-dimensional marginal distributions are given in Fig. A.5. The ![]() levels are indicated by the various colorbars. Top left: correlation map of the marginal two-dimensional parameter space (ΔΠ1,asym, q). The darkest shade indicates the most likely solution. Bottom left: correlation map of the marginal two-dimensional parameter space (ΔΠ1,asym, ϵg). A strong correlation is observed between the two parameters. Bottom right: correlation map of the marginal two-dimensional parameter space (q, ϵg). Correlation maps for the other two stars in our sample are given in the Appendix.
levels are indicated by the various colorbars. Top left: correlation map of the marginal two-dimensional parameter space (ΔΠ1,asym, q). The darkest shade indicates the most likely solution. Bottom left: correlation map of the marginal two-dimensional parameter space (ΔΠ1,asym, ϵg). A strong correlation is observed between the two parameters. Bottom right: correlation map of the marginal two-dimensional parameter space (q, ϵg). Correlation maps for the other two stars in our sample are given in the Appendix.
Current usage metrics show cumulative count of Article Views (full-text article views including HTML views, PDF and ePub downloads, according to the available data) and Abstracts Views on Vision4Press platform.
Data correspond to usage on the plateform after 2015. The current usage metrics is available 48-96 hours after online publication and is updated daily on week days.
Initial download of the metrics may take a while.