Fig. 1
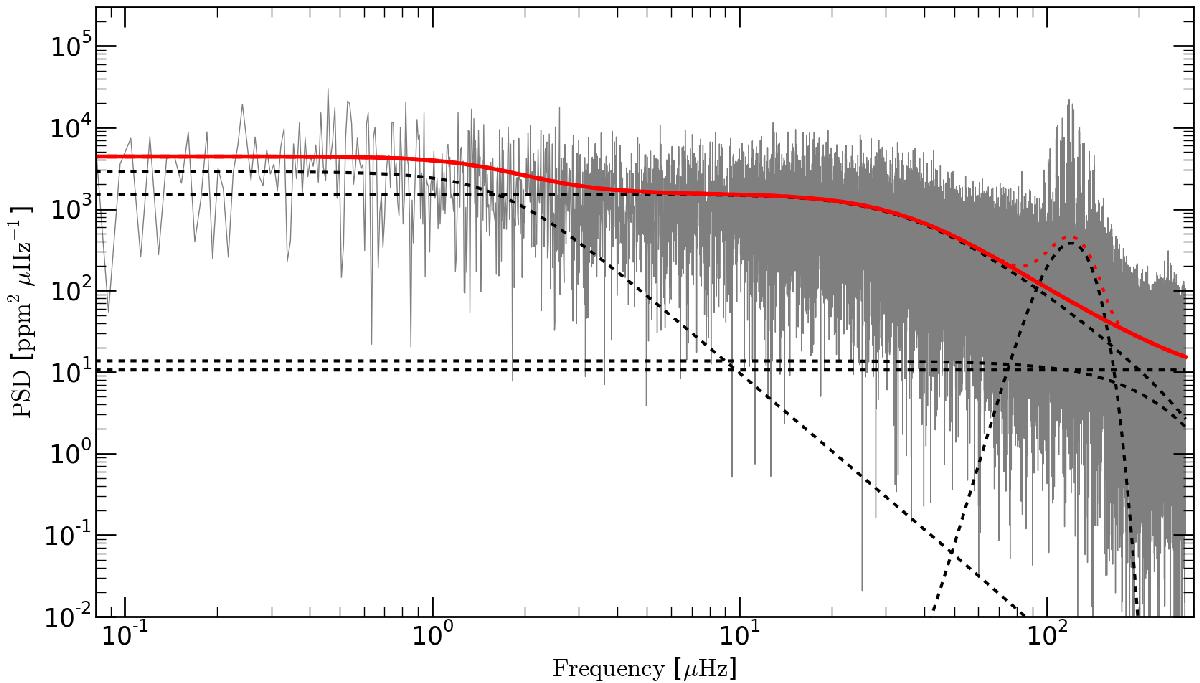
Power density spectrum of the Kepler photometry of KIC 6928997. The individual components describing the background of the PDS are indicated by black dotted lines, their joint effect by the red full line, and the power excess by the red dashed line. Only the red solid line is used as background during the extraction of the oscillations.
Current usage metrics show cumulative count of Article Views (full-text article views including HTML views, PDF and ePub downloads, according to the available data) and Abstracts Views on Vision4Press platform.
Data correspond to usage on the plateform after 2015. The current usage metrics is available 48-96 hours after online publication and is updated daily on week days.
Initial download of the metrics may take a while.