Fig. 9
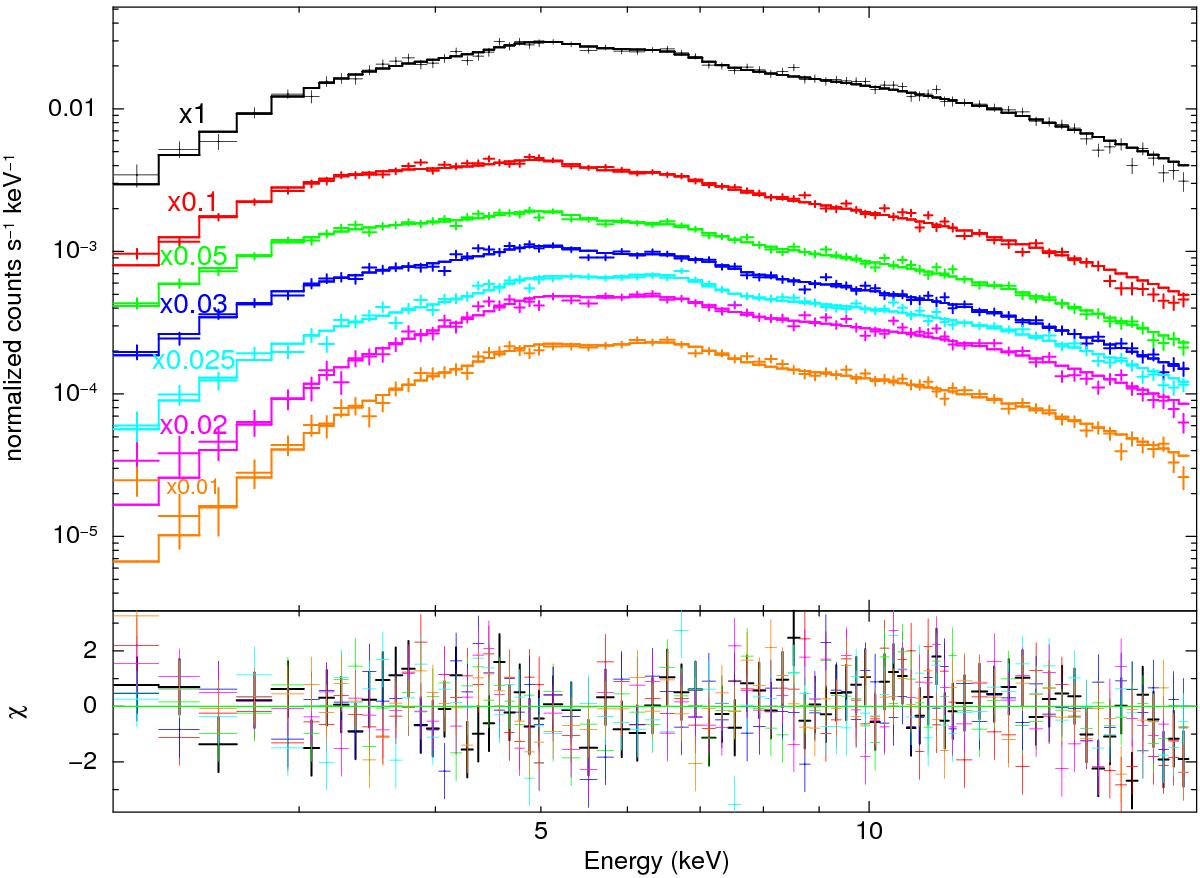
Orbital phase-resolved spectra of the standard sample fit with a partial covering model, when significant (see text). Top panel (from top to bottom): data and folded model of the spectra in phase bins from φ1 to φ7. Bottom panel: residuals for the best-fit model. Symbols are the same as in Fig. 8. See Table 4 for all spectral parameters.
Current usage metrics show cumulative count of Article Views (full-text article views including HTML views, PDF and ePub downloads, according to the available data) and Abstracts Views on Vision4Press platform.
Data correspond to usage on the plateform after 2015. The current usage metrics is available 48-96 hours after online publication and is updated daily on week days.
Initial download of the metrics may take a while.