Fig. 5
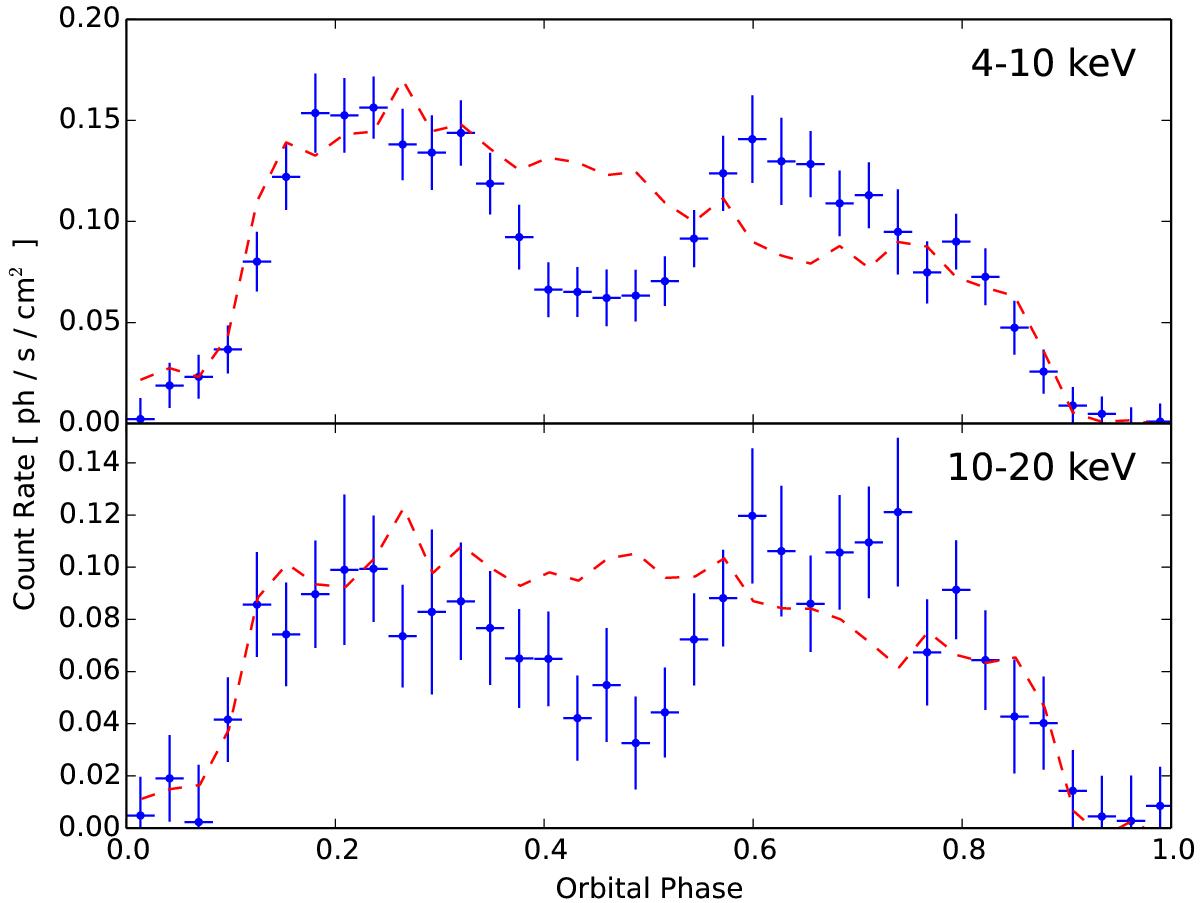
Average orbital profiles of the double-peaked and of the standard samples in 4−10 keV (top) and 10−20 keV (bottom). The blue dots are the data points obtained by stacking the memebers with large residuals in the Y phase bin (see text). The vertical error bars correspond to the standard deviation of the average of the count rates in each phase bin, while the horizontal bars indicate the phase-bin width. The red dashed lines represents the function interpolated between the data points of the standard samples in each energy band.
Current usage metrics show cumulative count of Article Views (full-text article views including HTML views, PDF and ePub downloads, according to the available data) and Abstracts Views on Vision4Press platform.
Data correspond to usage on the plateform after 2015. The current usage metrics is available 48-96 hours after online publication and is updated daily on week days.
Initial download of the metrics may take a while.