Fig. 4
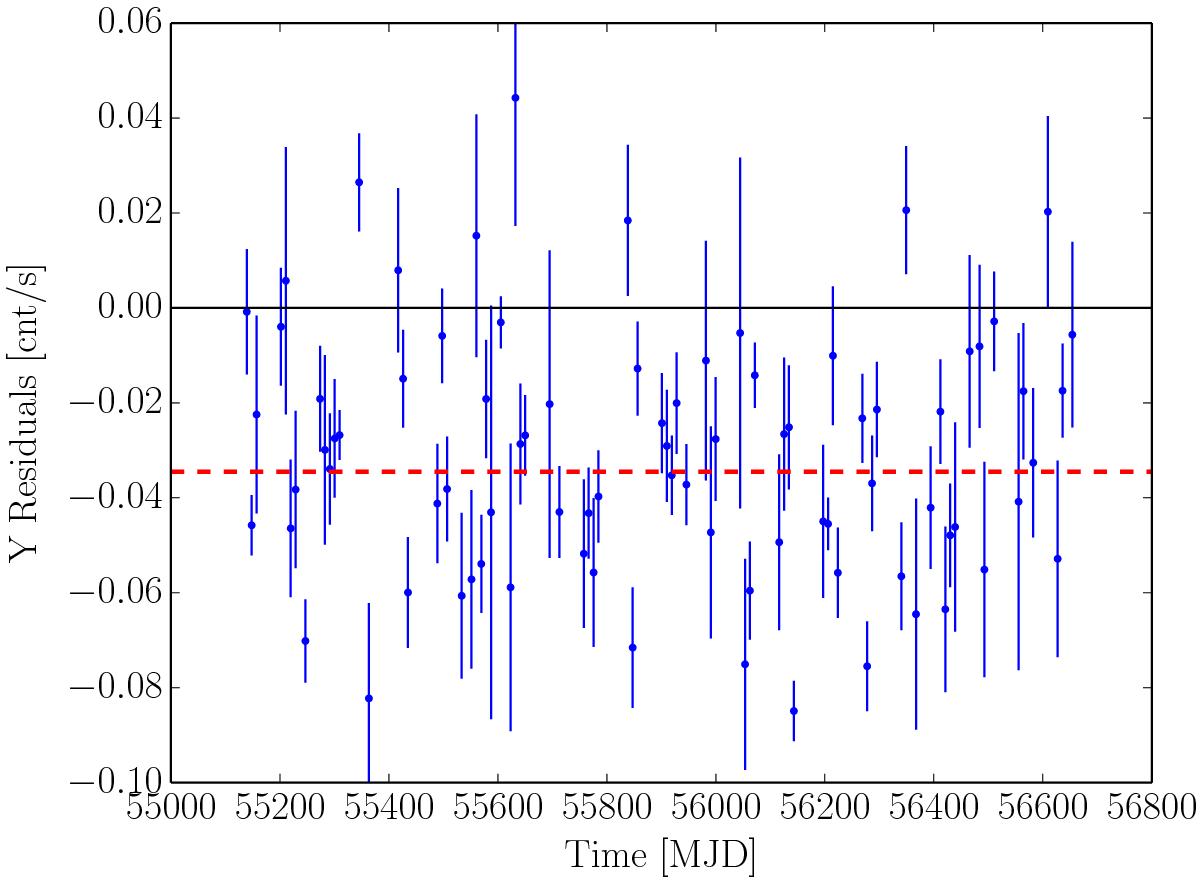
Residuals of single orbital profiles from the template in the 4−10 keV energy band for the Y phase-bin (see text). The residuals are compared to the observation time on the x-axis. The thin black line is the zero-value, while the red dashed line is the 30% limit below which the selection criterion in the Y phase-bin is fullfilled. Error bars correspond to the sample standard deviation (σ/![]() , with N number of data points). Not all the profiles below the red dashed line are selected as double-peaked profiles because of the conditions imposed on the X and Z phase-bins.
, with N number of data points). Not all the profiles below the red dashed line are selected as double-peaked profiles because of the conditions imposed on the X and Z phase-bins.
Current usage metrics show cumulative count of Article Views (full-text article views including HTML views, PDF and ePub downloads, according to the available data) and Abstracts Views on Vision4Press platform.
Data correspond to usage on the plateform after 2015. The current usage metrics is available 48-96 hours after online publication and is updated daily on week days.
Initial download of the metrics may take a while.