Fig. 3
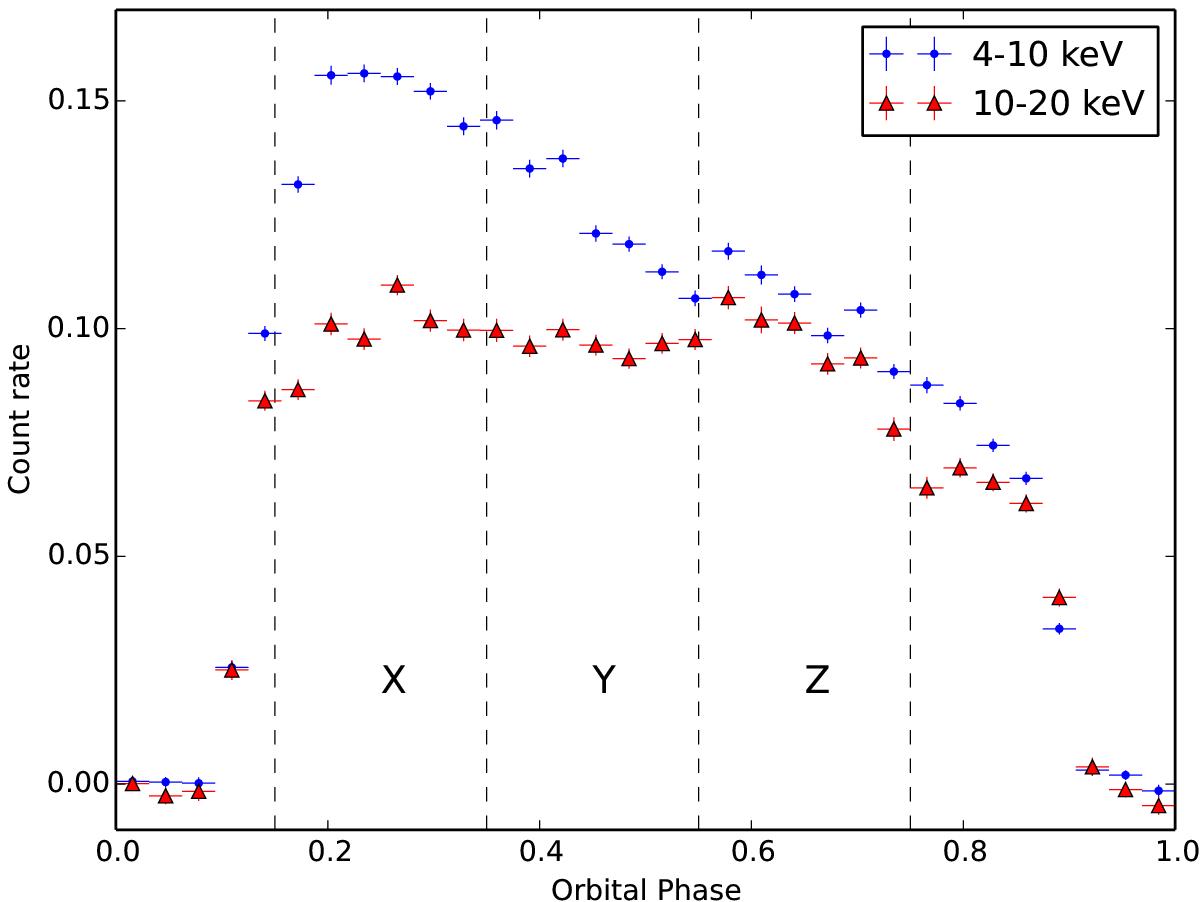
Vela X-1 folded orbital light curves in 4−10 (blue dots), and 10−20 keV (red triangles) energy ranges. The horizontal bars indicate the phase-bin. The mid-eclipse time is taken as the phase zero. The three orbital phase bins (X, Y, and Z) used for the phase-resolved spectroscopy of the double-peaked sample are indicated (see text).
Current usage metrics show cumulative count of Article Views (full-text article views including HTML views, PDF and ePub downloads, according to the available data) and Abstracts Views on Vision4Press platform.
Data correspond to usage on the plateform after 2015. The current usage metrics is available 48-96 hours after online publication and is updated daily on week days.
Initial download of the metrics may take a while.