Fig. 2
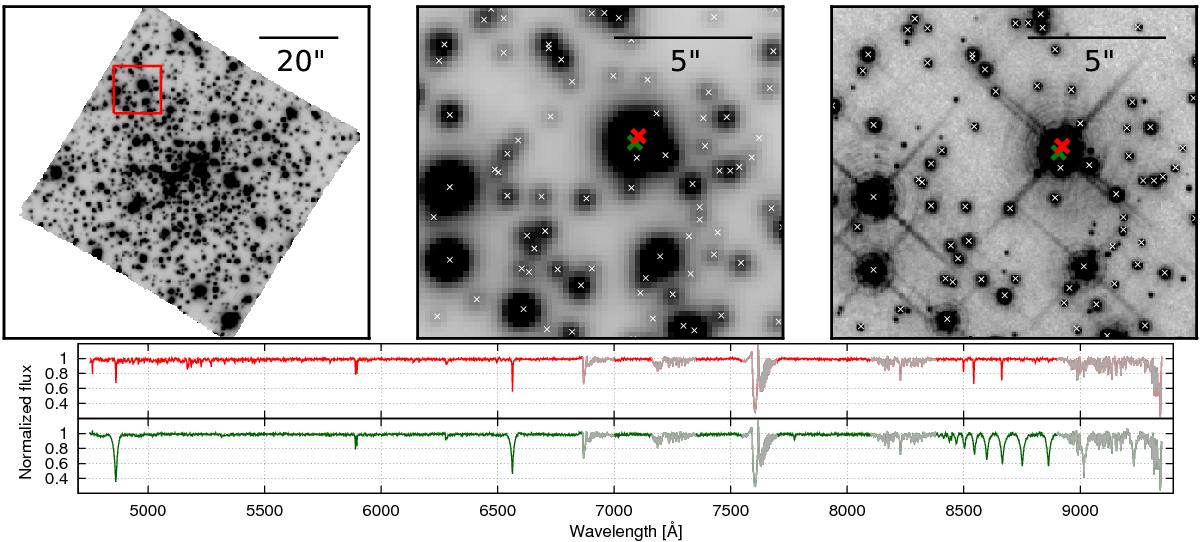
Deblending of stellar spectra on MUSE data. The top left panel shows a white light image of the central MUSE datacube in NGC 6397. A zoom into the area indicated with a red square is shown in the top middle panel. In the top right panel, the same field of view is shown as seen with HST. All stars for which spectra were extracted are shown with crosses. Spectra extracted from the stars indicated with the red and green crosses are shown in the bottom panel and show clearly distinct features without any contamination from each other. The star indicated in red was determined to be a late-type G star, while the star in green is type A. The spectra are continuum subtracted and normalised and the areas dominated by telluric absorption are indicated in grey for clarity.
Current usage metrics show cumulative count of Article Views (full-text article views including HTML views, PDF and ePub downloads, according to the available data) and Abstracts Views on Vision4Press platform.
Data correspond to usage on the plateform after 2015. The current usage metrics is available 48-96 hours after online publication and is updated daily on week days.
Initial download of the metrics may take a while.