Fig. 14
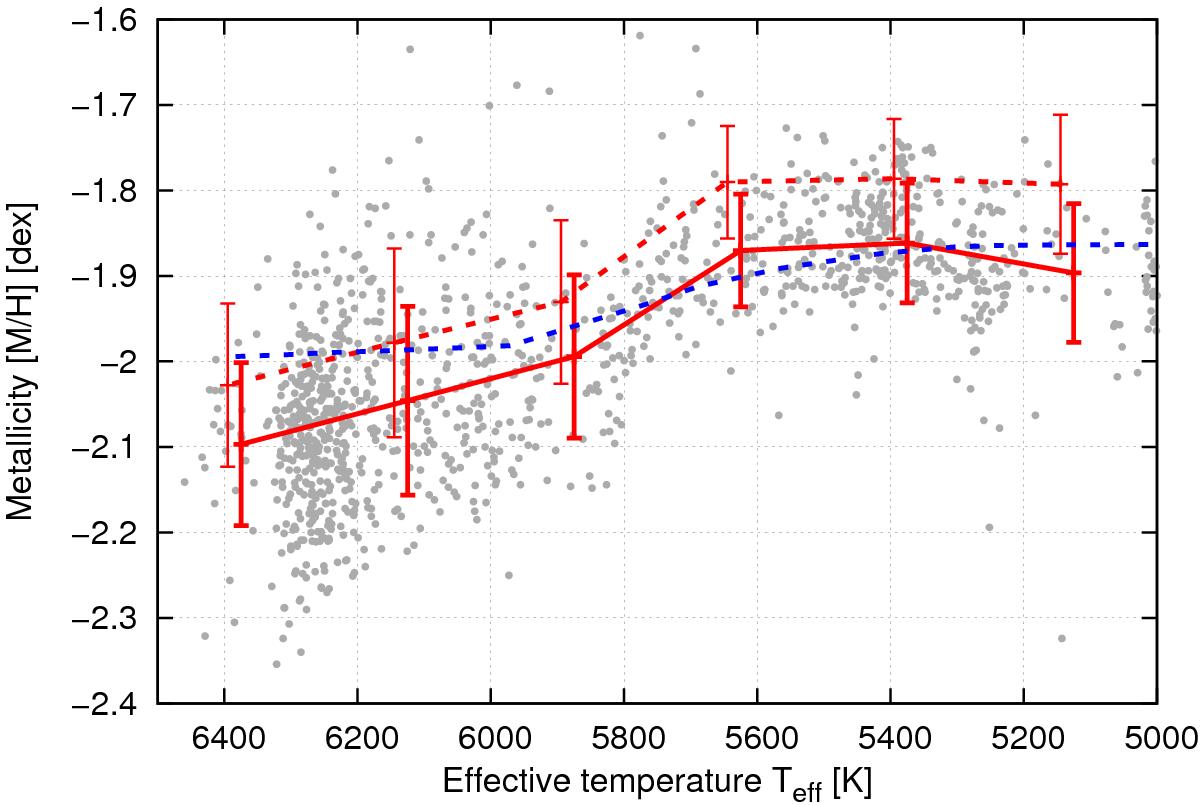
Metallicity trend with effective temperature for all spectra with log g < 4.4 (i.e. stars between the TO and the tip of the RGB) and S/N> 50. Overplotted with a solid red line are the mean values and standard deviations of the metallicity in 250 K wide bins. The same is plotted again with a dashed red line including a correction (Lind et al. 2012) for NLTE effects (with the same uncertainties). Overplotted in blue is an isochrone including atomic diffusion (Richard, priv. comm.). See text for details.
Current usage metrics show cumulative count of Article Views (full-text article views including HTML views, PDF and ePub downloads, according to the available data) and Abstracts Views on Vision4Press platform.
Data correspond to usage on the plateform after 2015. The current usage metrics is available 48-96 hours after online publication and is updated daily on week days.
Initial download of the metrics may take a while.