Fig. 11
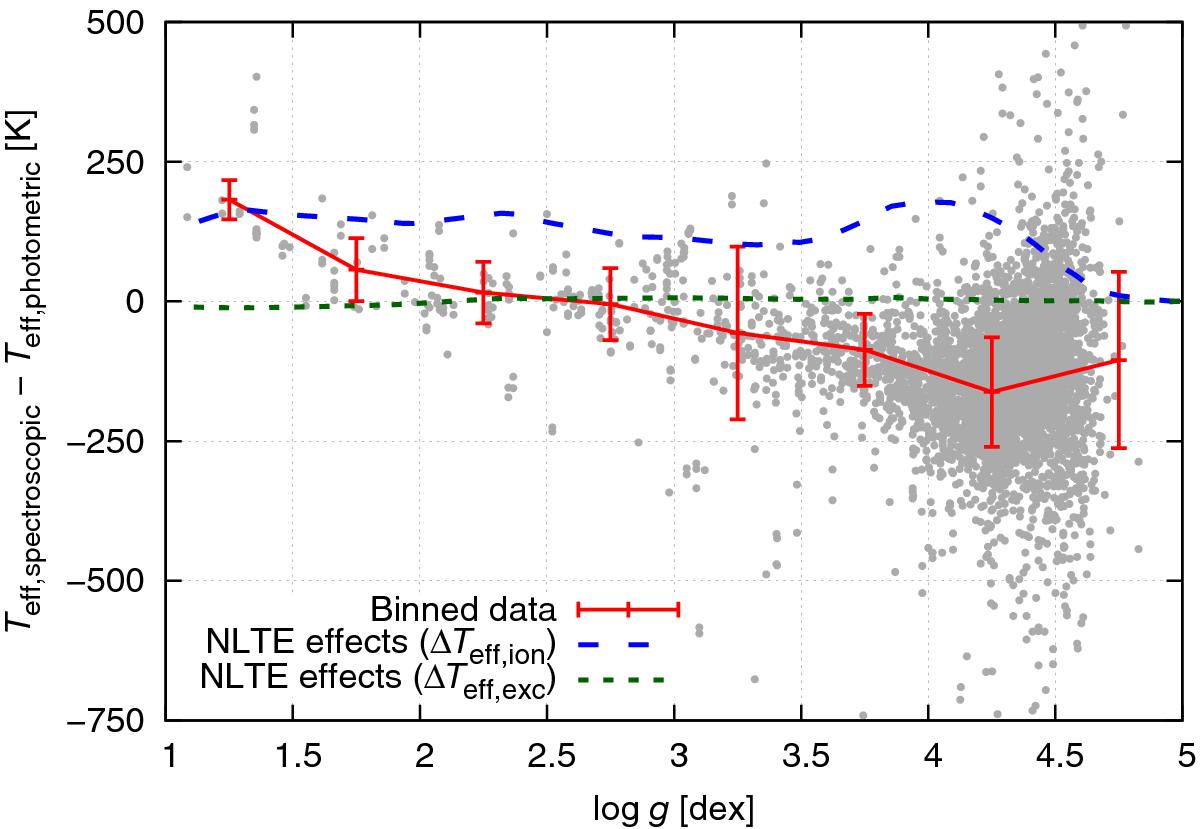
Comparison of our photometric and spectroscopic results for Teff as a function of log g. The red error bars indicate the mean and standard deviation of the discrepancies in 0.5 dex wide bins. Overplotted in blue and green are predicted offsets due to neglected NLTE effects as shown in Lind et al. (2012). See text for details.
Current usage metrics show cumulative count of Article Views (full-text article views including HTML views, PDF and ePub downloads, according to the available data) and Abstracts Views on Vision4Press platform.
Data correspond to usage on the plateform after 2015. The current usage metrics is available 48-96 hours after online publication and is updated daily on week days.
Initial download of the metrics may take a while.