Fig. 1
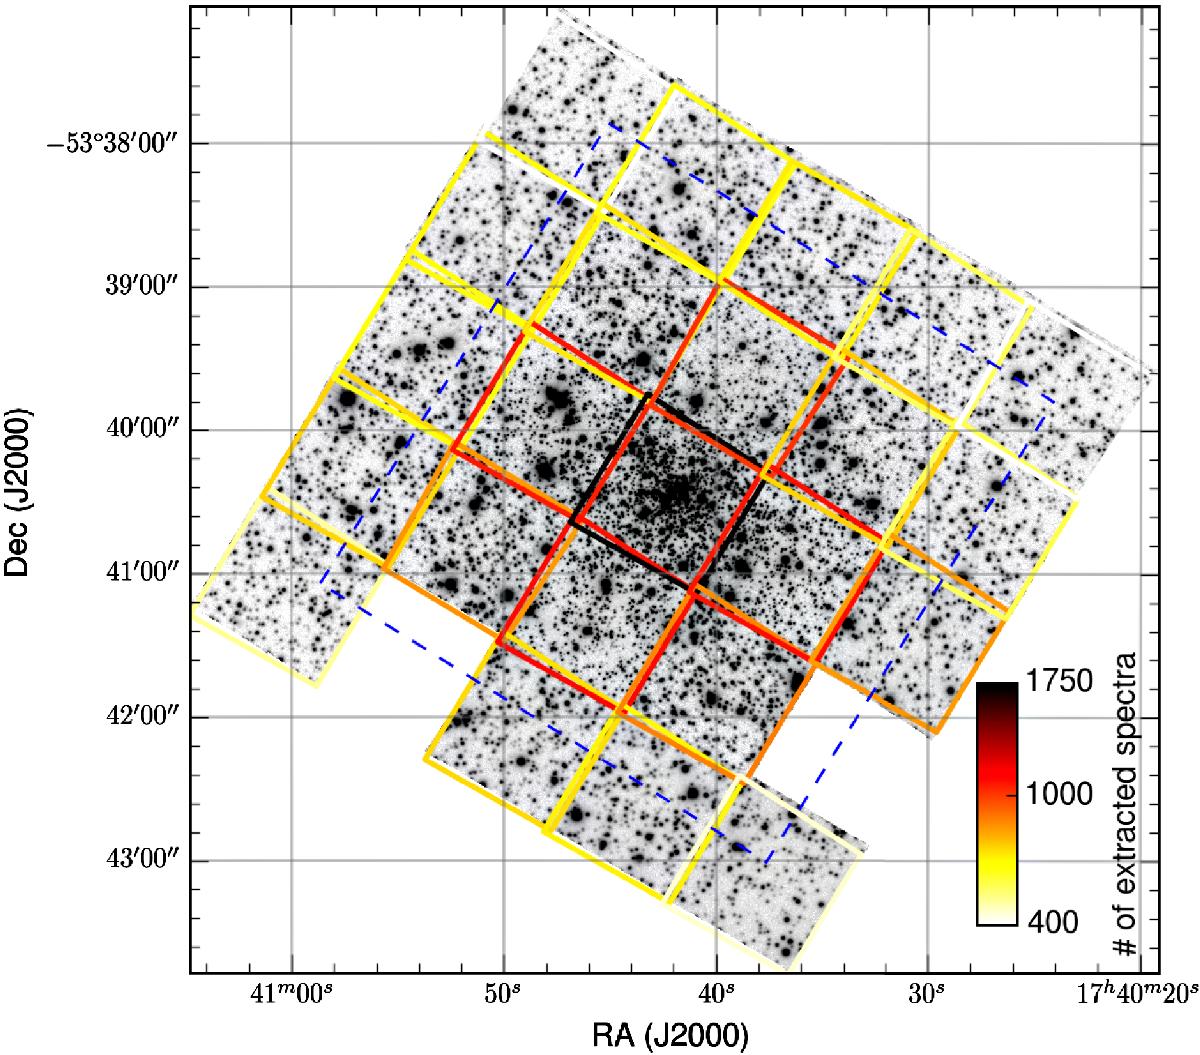
V-band image extracted from the mosaic of MUSE datacubes of NGC 6397. Overplotted are the single pointings, which have been observed multiple times at different position angles and with little offsets. Two of the planned pointings were not carried out, so the mosaic is incomplete. The colour coding indicates the number of stellar spectra that were extracted from each pointing, ranging from ~1700 in the central pointing to about 400 in the outer fields. The dashed blue line indicates the area covered by the ACS survey of Galactic globular clusters (Sarajedini et al. 2007).
Current usage metrics show cumulative count of Article Views (full-text article views including HTML views, PDF and ePub downloads, according to the available data) and Abstracts Views on Vision4Press platform.
Data correspond to usage on the plateform after 2015. The current usage metrics is available 48-96 hours after online publication and is updated daily on week days.
Initial download of the metrics may take a while.