Fig. 7
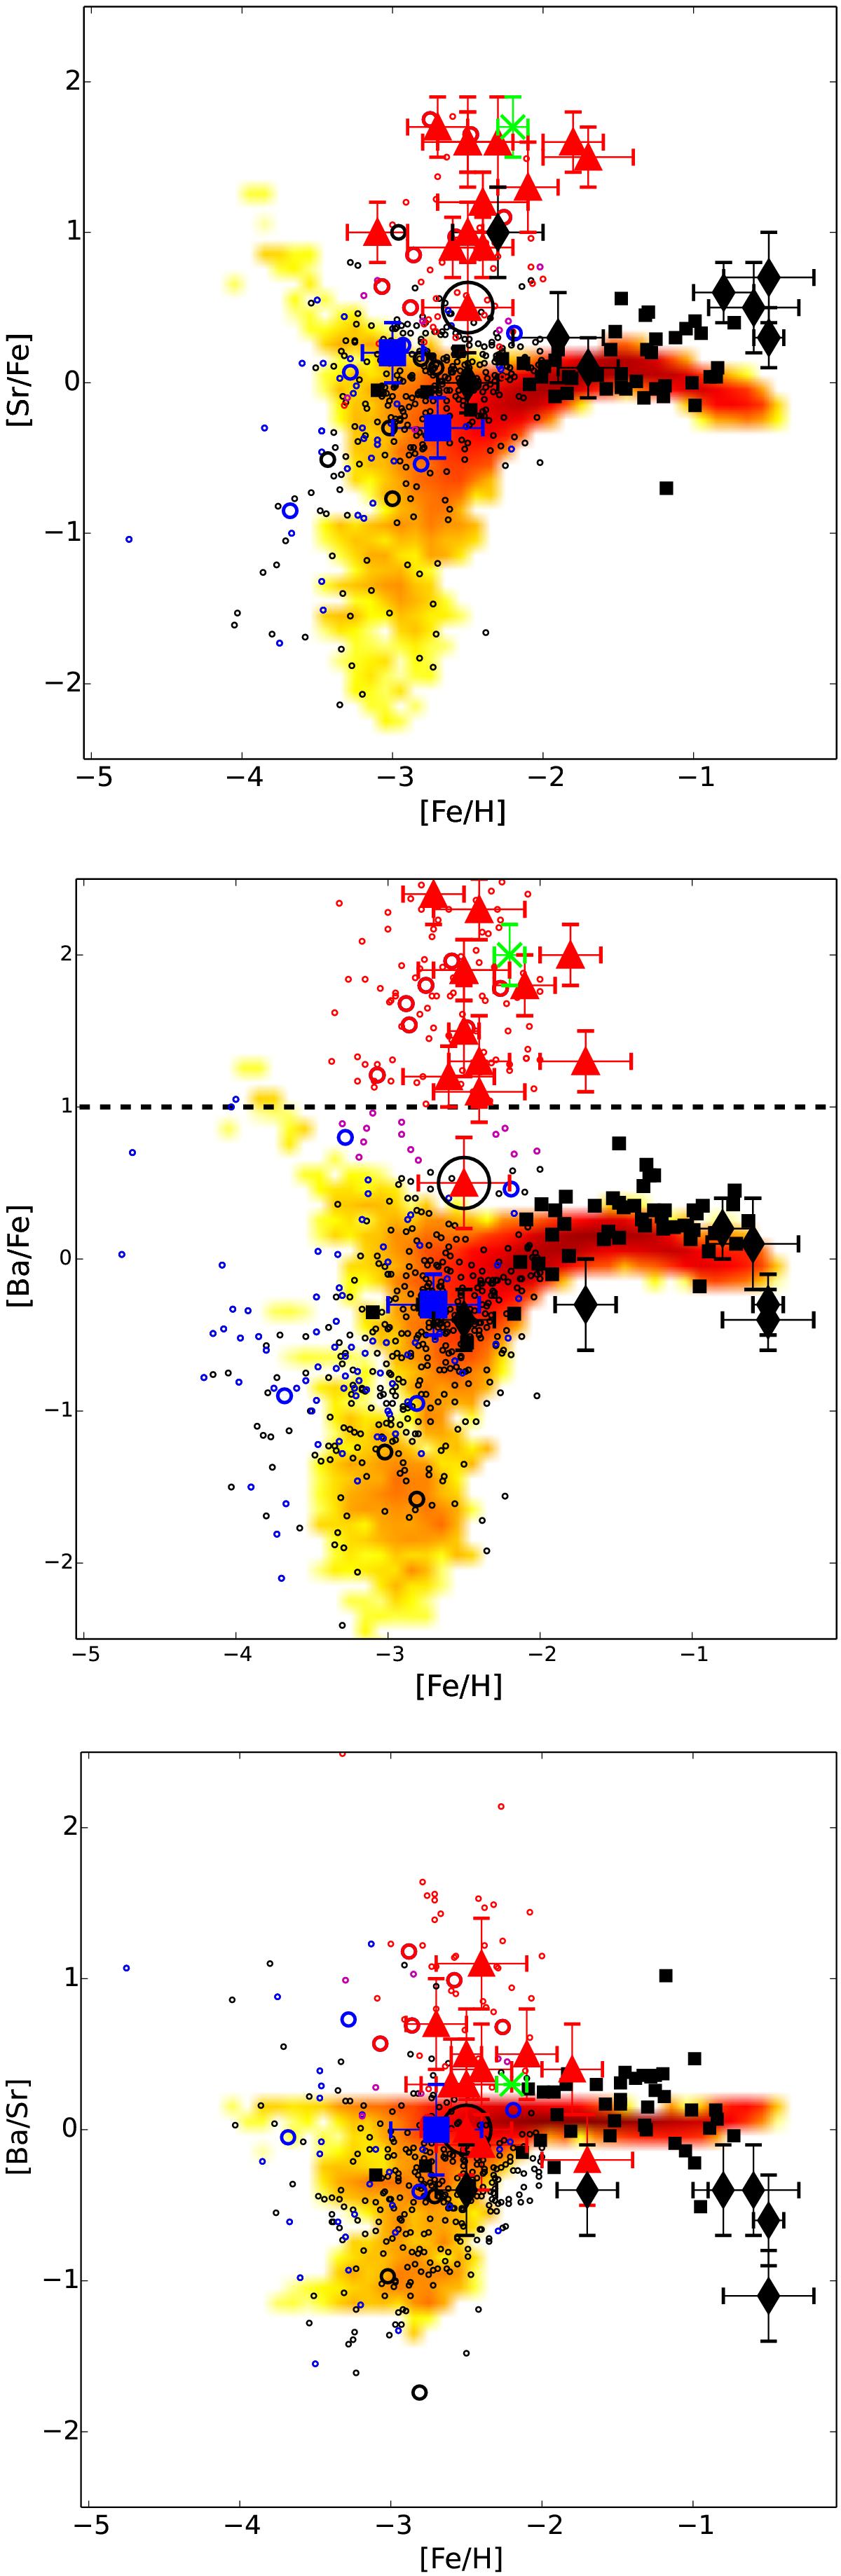
Neutron-capture element abundances vs. [Fe/H] for our stars compared to metal-poor star samples from Hansen et al. (2012, black squares), Hansen et al. (2015, large open circles), and Placco et al. (2014b and references therein, small open circles). Colours and symbols are as in Fig. 2. The red-yellow cloud shows the GCE predictions, where red indicates a larger number density of stars than yellow. The dashed line at [Ba/Fe] = 1.0 in the middle panel separates carbon-normal from CEMP-s stars. The bottom panel shows [Ba/Sr] vs. [Fe/H].
Current usage metrics show cumulative count of Article Views (full-text article views including HTML views, PDF and ePub downloads, according to the available data) and Abstracts Views on Vision4Press platform.
Data correspond to usage on the plateform after 2015. The current usage metrics is available 48-96 hours after online publication and is updated daily on week days.
Initial download of the metrics may take a while.