Free Access
Fig. 1
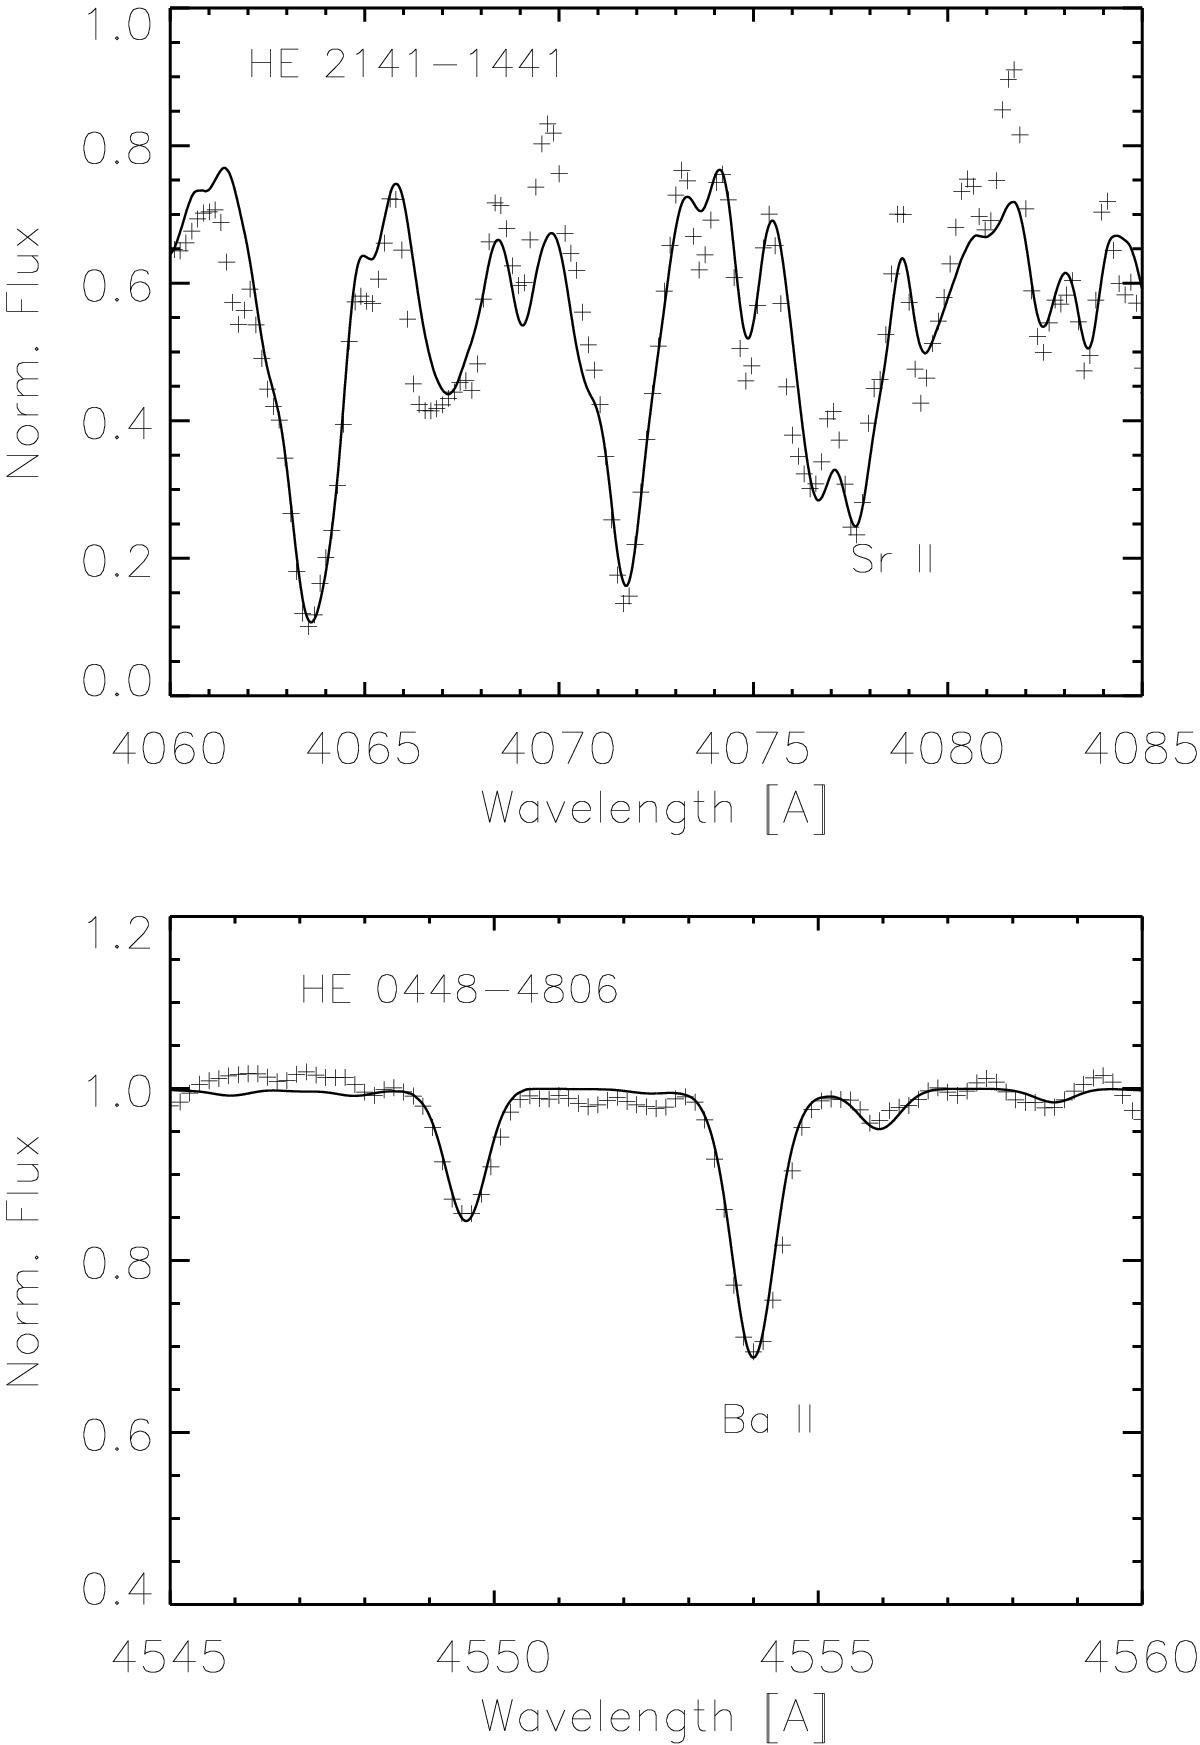
Synthetic spectrum fits to the Sr II 407.7 nm (upper panel) and Ba II 455.4 nm lines (lower panel). The observations of HE 2141−1441 (relatively metal rich, s-element poor) and HE 0448−4806 (relatively metal poor, s-element rich) are shown as black plus signs.
This figure is made of several images, please see below:
Current usage metrics show cumulative count of Article Views (full-text article views including HTML views, PDF and ePub downloads, according to the available data) and Abstracts Views on Vision4Press platform.
Data correspond to usage on the plateform after 2015. The current usage metrics is available 48-96 hours after online publication and is updated daily on week days.
Initial download of the metrics may take a while.