Free Access
Fig. 22
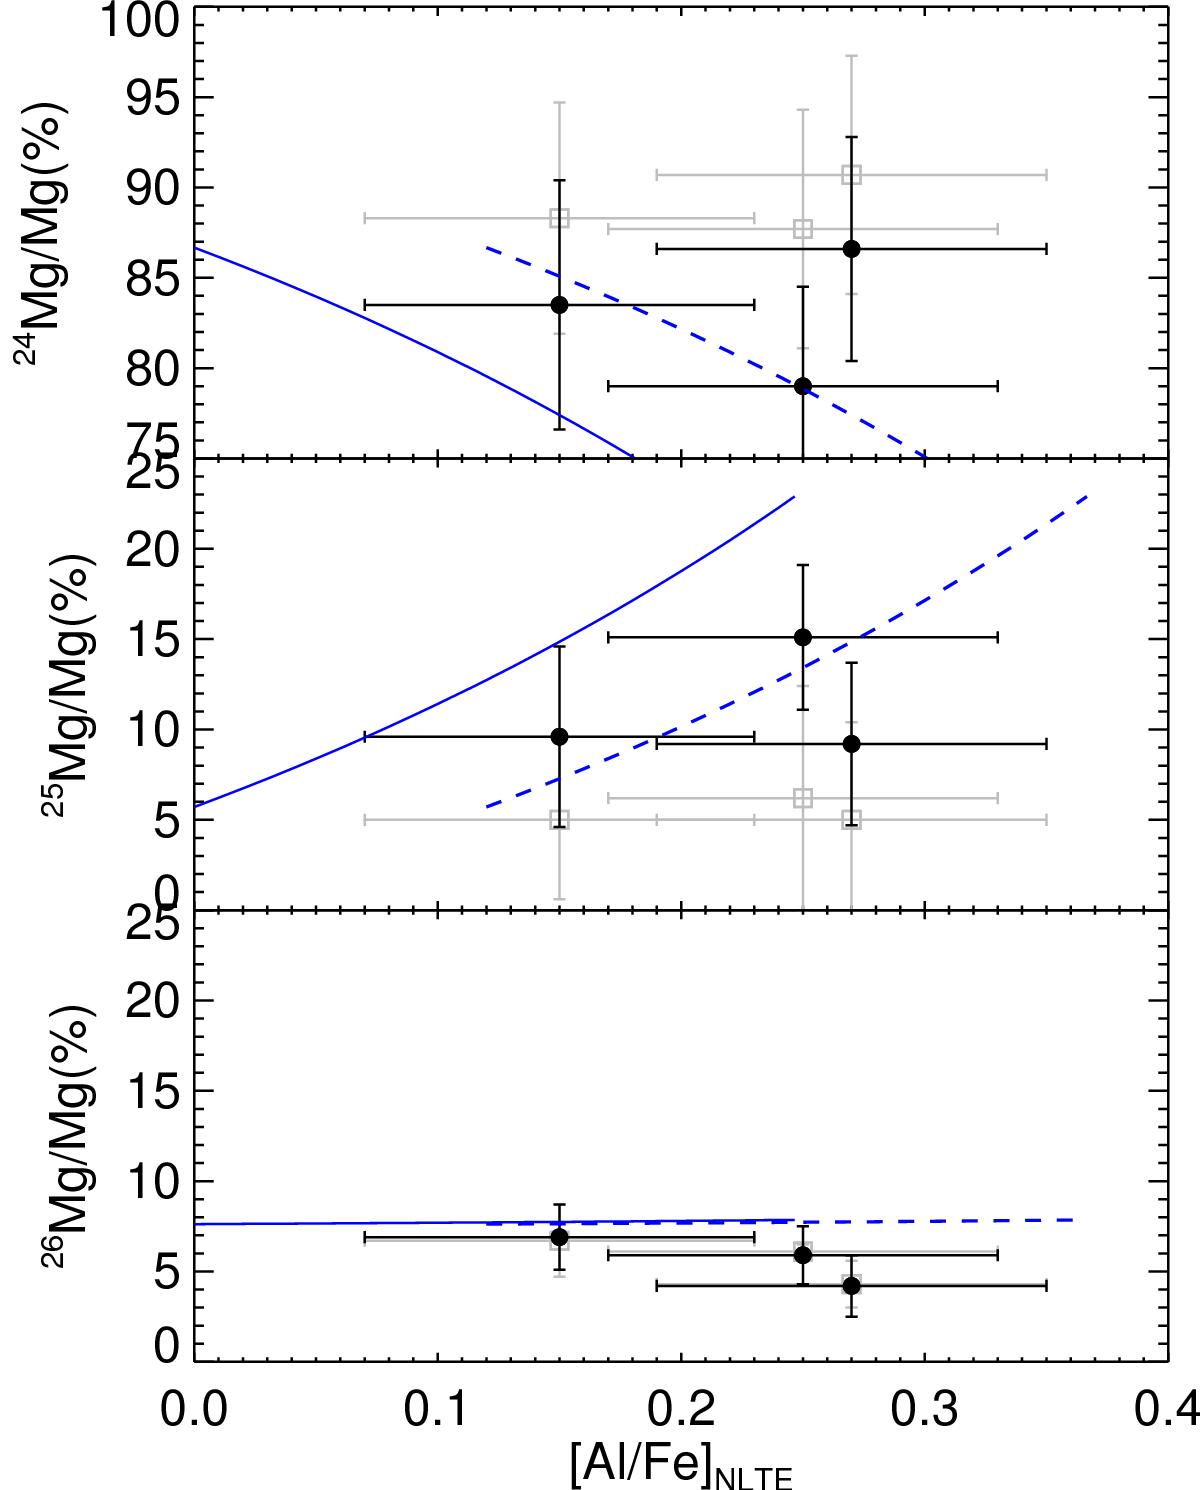
Isotopic fractions vs. [Al/Fe] for the stars with 3D results. The solid blue lines is the predicted composition of the stars from Ventura et al. (2014). The dashed lines shows the dilution curve, when shifted by +0.12 dex in [Al/Fe]. Symbols have the same meaning as in Fig. 21.
Current usage metrics show cumulative count of Article Views (full-text article views including HTML views, PDF and ePub downloads, according to the available data) and Abstracts Views on Vision4Press platform.
Data correspond to usage on the plateform after 2015. The current usage metrics is available 48-96 hours after online publication and is updated daily on week days.
Initial download of the metrics may take a while.