Fig. 19
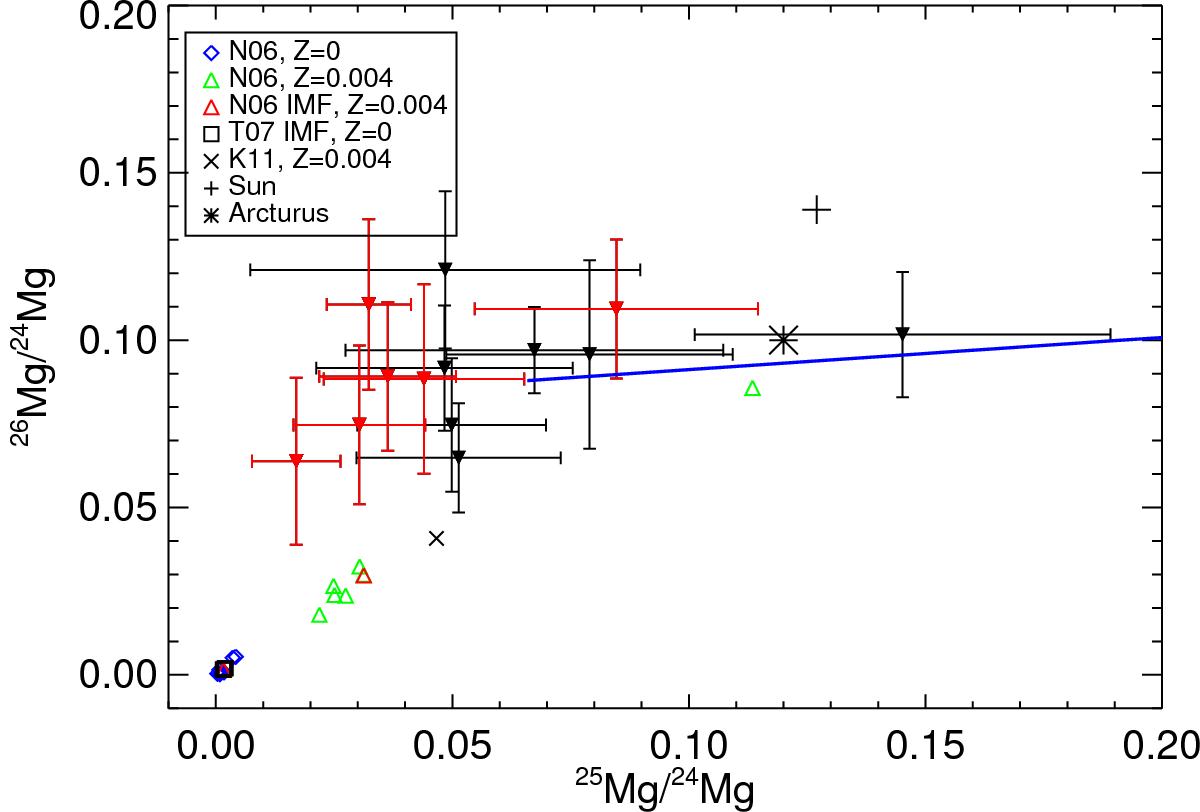
26Mg/24Mg vs. 25Mg/24Mg measured in our sample. Shown are also isotopic ratios from the supernova yields of Nomoto et al. (2006) (Z = 0, blue diamonds; Z = 0.004, green triangles; Z = 0.004 IMF weighted value, red triangle), Tominaga et al. (2007) (Z = 0, black squares) and from the chemical evolution model of Kobayashi et al. (2011) (black X). Shown is also the dilution curve for the isotopes using the model form Ventura et al. (2014). The solar position is shown with a black cross, and our values for Arcturus with a black asterisk.
Current usage metrics show cumulative count of Article Views (full-text article views including HTML views, PDF and ePub downloads, according to the available data) and Abstracts Views on Vision4Press platform.
Data correspond to usage on the plateform after 2015. The current usage metrics is available 48-96 hours after online publication and is updated daily on week days.
Initial download of the metrics may take a while.