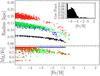
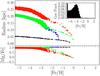
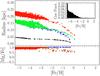
Fig. 8
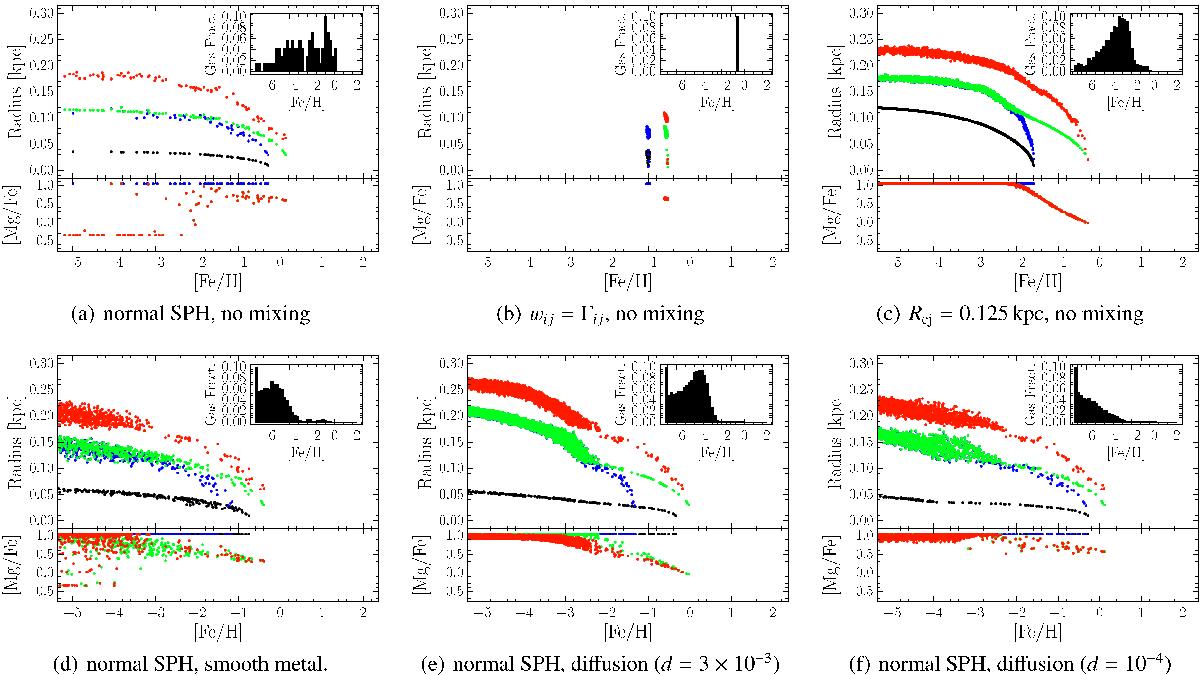
Evolution of the particles touched by the supernova feedback is shown for different element ejection schemes (see text). The upper parts of the plots show the radius as a function of the metallicity. The lower parts indicate the [Mg/Fe] ratio as a function of [Fe/H]. The black dots show particles at t1, just after the first explosion; the blue dots at t2, just before the second explosion; the green dots at t3, just after the second explosion; and the red dots at t4, at the end of the run. The histograms on the upper right indicate the metallicity distribution function at t4.
Current usage metrics show cumulative count of Article Views (full-text article views including HTML views, PDF and ePub downloads, according to the available data) and Abstracts Views on Vision4Press platform.
Data correspond to usage on the plateform after 2015. The current usage metrics is available 48-96 hours after online publication and is updated daily on week days.
Initial download of the metrics may take a while.