Free Access
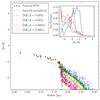
Fig. 7
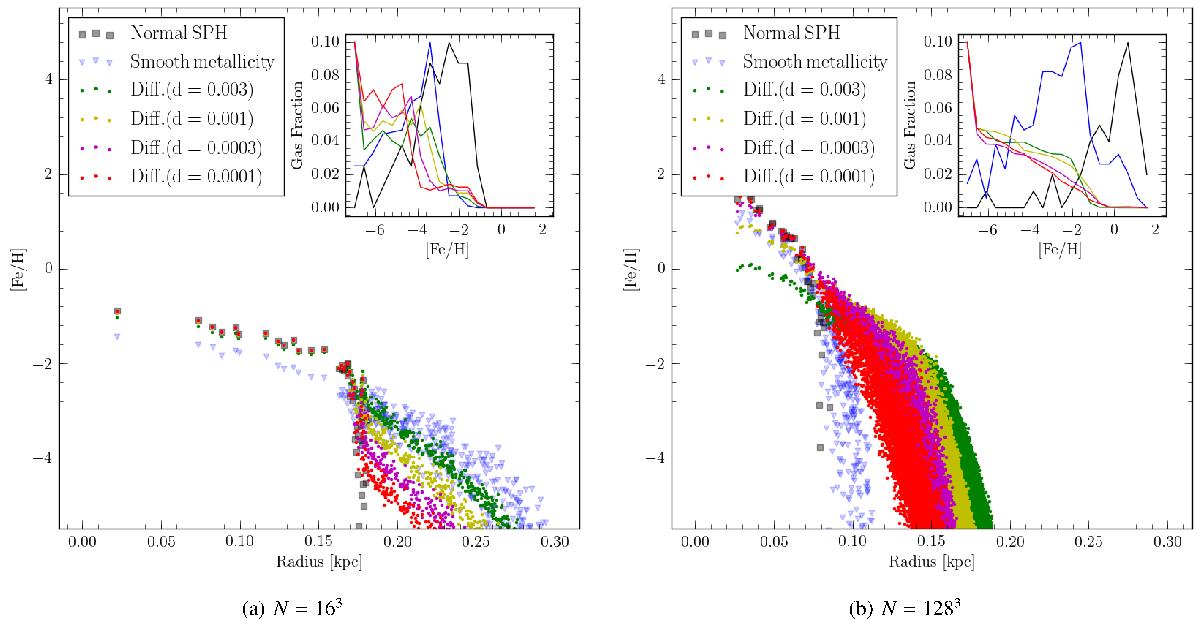
Metallicity profile after 5 Myr, for three different schemes: normal SPH (model “a”), smooth metallicity (model “d”), and metal diffusion (models “e” to “h”). The upper panel shows the metallicity distribution function (independent of time in this particular experiment) for the N = 163 and N = 1283 models.
This figure is made of several images, please see below:
Current usage metrics show cumulative count of Article Views (full-text article views including HTML views, PDF and ePub downloads, according to the available data) and Abstracts Views on Vision4Press platform.
Data correspond to usage on the plateform after 2015. The current usage metrics is available 48-96 hours after online publication and is updated daily on week days.
Initial download of the metrics may take a while.