Fig. 6
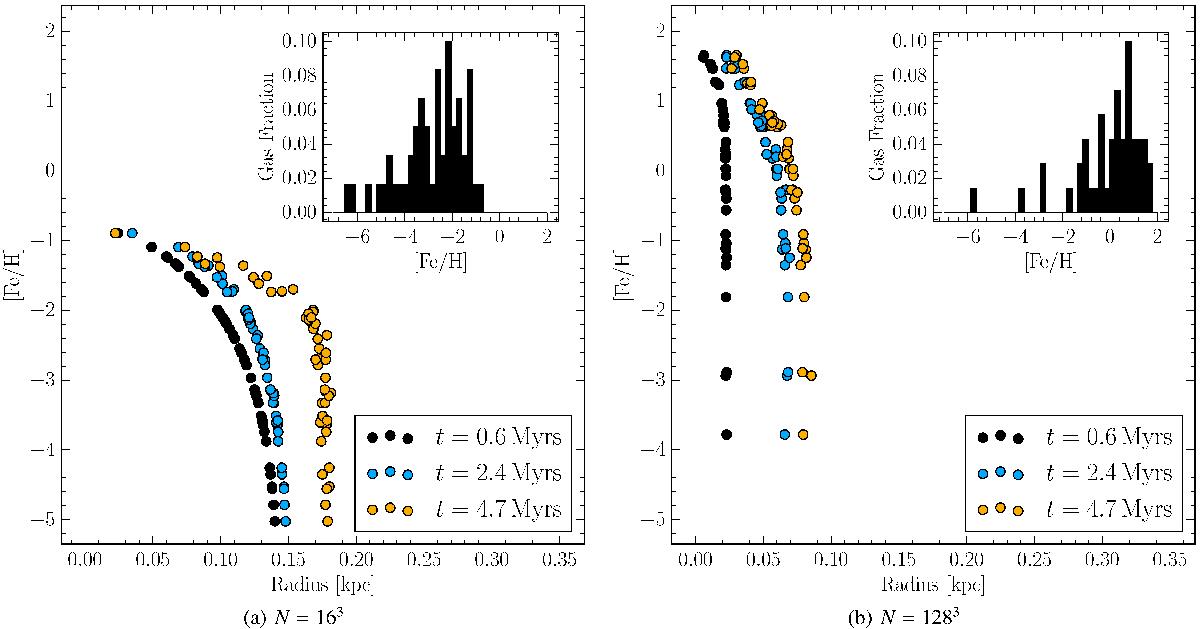
Effects of the resolution on the evolution of the metallicity profile of particles that received feedback in our fiducial model “a”, with a resolution of N = 163a) and N = 1283b). Each curve corresponds to a different times, 0.6, 2.4, and 4.7 Myr after the supernova explosion. The upper right panel shows the iron distribution function which, in this particular experiment, is independent of time.
Current usage metrics show cumulative count of Article Views (full-text article views including HTML views, PDF and ePub downloads, according to the available data) and Abstracts Views on Vision4Press platform.
Data correspond to usage on the plateform after 2015. The current usage metrics is available 48-96 hours after online publication and is updated daily on week days.
Initial download of the metrics may take a while.