Fig. 19
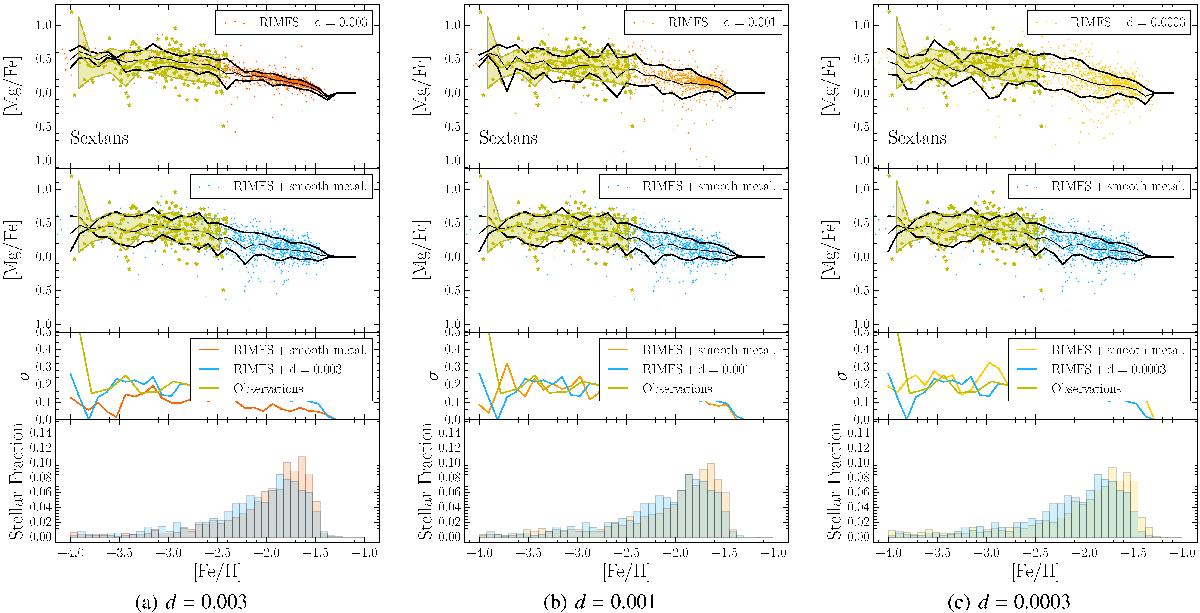
Effect of the coefficient diffusion on the final [Mg/Fe] dispersion of the Sextans (r= 6) models. Each panel corresponds to a different coefficient. The dispersion is compared to the fiducial model run with the smooth metallicity scheme. As in Figs. 10 and 11, the black curves show the 1σ dispersion. For comparison, observations at low metallicity ([ Mg / Fe ] < −2.5) of individual stars taken from Fig. 1 are shown in yellow. In each [Mg/Fe] vs. [Fe/H] plots, the shaded region corresponds to the 1σ dispersion around the mean. Individual measurements are shown with small stars.
Current usage metrics show cumulative count of Article Views (full-text article views including HTML views, PDF and ePub downloads, according to the available data) and Abstracts Views on Vision4Press platform.
Data correspond to usage on the plateform after 2015. The current usage metrics is available 48-96 hours after online publication and is updated daily on week days.
Initial download of the metrics may take a while.